2025 Economic and Market Review
January 13, 2026
.jpg "iStock-1316289762_Global Markets (6).jpg")
As we enter 2026, the PMAM investment team reflects on 2025, highlighting the key economic and financial market themes that shaped the year.
ECONOMIC GROWTH & INFLATION
The U.S. economy continues to show surprising resilience. Economic forecasters, including those inside the Federal Reserve (Fed), had consistently underestimated the strength of the U.S. economy since the first rate hike in 2022. However, with the Fed beginning its current rate-cutting cycle at the end of 2024, the table has turned. 2025 was different for several reasons. The Fed currently expects 2025 gross domestic product (GDP) to come in near 1.7%, below the 2.1% projected by policymakers at the start of the year.1 The uncertainty around Liberation Day and the resulting tariffs had negative economic implications in 2025.2 Moreover, the government shutdown in the fall of 2025, the longest in U.S. history, also negatively impacted economic growth.3 Corporations and consumers will adjust to the changes as there is more clarity. This is expected to support accelerated growth in 2026, provided that labor market conditions remain stable.
U.S. consumers accelerated purchases in early 2025 to avoid anticipated tariff-driven price hikes, but spending slowed in the second quarter amid rising uncertainty.4 The economy is best described as K-shaped, with the higher-income households continuing to spend while others focused on cost and essentials. The generally slower spending throughout the year and material negative revisions to the U.S. labor market shifted the Fed’s focus from inflation to employment, as it manages both sides of its dual mandate.
In September 2025, the Bureau of Labor Statistics revised nonfarm payrolls lower by 911,000 jobs (-0.6%) for the 12-month period ending in March 2025, a larger change than the previous decade’s average absolute annual revision of 0.2%.5 The unemployment rate rose to 4.4%, up from 4.1% at the end of 2024.6 While nonfarm payrolls have mostly weakened since Liberation Day, September saw a better-than-expected increase of 119,000 jobs, which is well above the approximately 50,000 needed monthly to keep unemployment stable.7 By November, the unemployment rate had edged up to 4.6%, with 64,000 jobs added.8 The November payroll data was released in December, alongside the weaker October nonfarm payroll numbers, which were affected by the government shutdown.9 As a result, the direction of the labor market remains unclear with the distorted and delayed government data adding to the haze.
Despite the softening labor market, inflation has remained stubbornly higher than the Fed’s 2% target. The U.S. Consumer Price Index (CPI) measure of monthly inflation ended the two months from September to November at 0.2%, which was better than feared, but again distorted by the government shutdown.10 The two-month inflation rate was lower than expected and has decreased sequentially from the September pace.11 Fed Chair Powell’s view on tariffs has evolved over the course of the year. The Fed kept rates unchanged for most of 2025, before implementing three ‘risk management’ cuts of 25 basis points (bps) each in September, October and December.12 These lower rates coupled with lower tax rates from the One Big Beautiful Bill Act (OBBBA) should be supportive of growth in 2026.
The U.S. and global economies are embarking on a growth phase bolstered by spending on artificial intelligence (AI)-related infrastructure, including data centers, power capacity and chip manufacturing. These investments are expected to boost economic growth and enhance productivity, which may help lower inflation. The critical question is whether these productivity gains will come at the expense of the labor market.
MONETARY & FISCAL POLICY
After cutting rates by 100 bps over three Federal Open Market Committee (FOMC) meetings in the second half of 2024, the Fed left the federal funds rate unchanged for the majority of 2025.13 Concerns regarding elevated inflation and the unknown impacts of the Trump administration’s tariff policy largely contributed to the pause. By September, the Fed renewed its easing stance and cut rates by 25 bps, citing rising downside risks to employment and a slowing economy. Chair Powell has reaffirmed the 2% inflation target and emphasized a balanced approach when employment and inflation objectives conflict. The Fed announced another rate cut in October along with the end of Quantitative Tightening (QT) by December 1. The growing concerns regarding the health of the labor market factored into the Fed’s decision to institute the ‘risk management’ cuts.
A third rate cut was delivered in December; however, the more surprising headlines centered on the announcement of the $40 billion monthly T-bill purchases beginning in December as ‘reserve management purchases’ to support liquidity in markets.14 These purchases, coupled with the monthly runoff of mortgage-backed securities being reinvested in T-bills, should provide ample liquidity for markets and help the Treasury and Fed maintain a cap on Treasury rates. This move was another reassurance and pivot by the Fed signaling not only an end to QT but a comfort with balance sheet expansion. The record-long U.S. government shutdown likely contributed to uncertainty surrounding the December decision and now influences expectations for the Fed’s action in January. With agencies such as the Bureau of Labor Statistics and Bureau of Economic Analysis shut down, the Fed was deprived of critical indicators. Fed Chair Powell described the situation as “driving in the fog,” signaling caution in policy decisions.15 The Congressional Budget Office (CBO) estimated the government shutdown shaved 1.5% off fourth quarter GDP growth.16
In May 2025, Moody’s downgraded the U.S. sovereign credit rating from Aaa (top tier) to Aa1, citing the persistent large fiscal deficits, rising debt and interest burdens as well as political gridlock preventing meaningful fiscal reforms.17 This marked the third major downgrade in history following S&P in 2011 and Fitch in 2023.18 Moody’s estimated that the U.S. debt reached $36 trillion with deficits projected to rise from 6.3% of GDP in 2024 to approximately 9% over the next decade.19,20 The fiscal deficit improved slightly in 2025 on an absolute basis and decreased to 5.9% of GDP.21 For context, both year’s deficits are approximately twice the long-term average annual fiscal deficit as a percentage of GDP.22 Moody’s also cited the extension of the 2017 Tax Cuts and Jobs Act (TCJA) could add $4 trillion to deficits over the same period.23 According to the CBO, interest payments and entitlement spending are expected to consume 78% of federal spending by 2035 .24
The CBO reported a deficit of $1.8 trillion in fiscal year 2025.25 It also reported that, for the first time, the federal government's interest expenses exceeded $1 trillion during the fiscal year.26 With interest costs now exceeding defense spending, debt service will be an even larger non-discretionary fiscal pressure. The OBBBA permanent tax cuts should be a tailwind for consumers and corporations but could add approximately $5 trillion in costs to the government.27 Markets will continue to monitor how the Treasury plans to fund its deficits and if the shortfalls can stay contained relative to GDP. Concerns early in 2025 related to government funding led to bond vigilantes pressuring interest rates higher. As the year progressed, Treasury yields have trended lower as the narrative shifted to expectations for a dovish new Fed Chair who will likely cut interest rates in 2026.28
INTEREST RATES & CREDIT
The Treasury market closed 2024 with a sharp increase in rates, finishing near the highest yields of the year.29 This sell-off in Treasuries continued into early January of 2025 as markets grew concerned about deficit spending and Treasury issuance. In 2025, rates generally trended lower, with the decline more pronounced at the front end of the curve. This has led the 2s/10s Treasury curve to steepen from 33 bps to 69 bps.30
Around Liberation Day in April, rates and credit spreads both moved higher, although the higher levels were short-lived. The bond rally gathered steam over the summer months and into the fall as it became more likely the Fed was going to resume its rate-cutting cycle. The softer labor market noted by Fed Chair Powell at Jackson Hole and the weaker August labor report shifted the attention of the Fed to a more balanced approach to its dual mandate. By October, the 10-year Treasury hit its lowest levels of the year, dropping below 4%.31 Markets digested weaker (and a lack of) economic data from the government shutdown. It’s rare to see a Fed cutting interest rates with earnings, stocks and unemployment at such strong levels. However, the Fed has so far been able to lower inflation and avoid a recession, resulting in the goldilocks scenario for markets.
With inflation still above the 2% target, albeit trending lower, the Fed continues to keep interest rates at restrictive levels. With its balanced approach to the dual mandate, rates are expected to continue the trend lower. Additionally, the Fed announced the end of QT, which was a key point for retiring Philadelphia Fed President Patrick Harker. In June, he mentioned that besides adjusting the federal funds rate, the Fed will also use its balance sheet as a tool to maintain market liquidity.32 The end of QT in December 2025 coupled with the ‘reserve management purchases’ of T-bills may also result in lower rates.
Lower rates should be supportive of the housing market and mortgage rates. Since the peak in early January, mortgage rates have declined nearly 116 bps to 6.25% as of December.33 A notable pickup in prepayment speeds has accompanied the recent decline in mortgage rates and indicates increasing prepayment risks ahead should mortgage rates fall further.34
Despite corporate credit spreads widening post Liberation Day—investment-grade spreads moved nearly 50% wider to 120 bps—credit markets remained resilient.35 The 2025 peak in spreads of 120 bps is still tight to the long-term average corporate credit spread of approximately 145 bps.36 High-yield corporates also performed well in 2025, generating a return of 8.62%, the best among U.S. fixed income.37 Total returns were led by BB-rated credits which benefited from being longer duration.38 Even with default rates as of December at 1.88%, approximately 137 bps lower than the long-term average, credit selection continues to be a key differentiator.39
Exhibit 1. 2025 Bond Market Performance
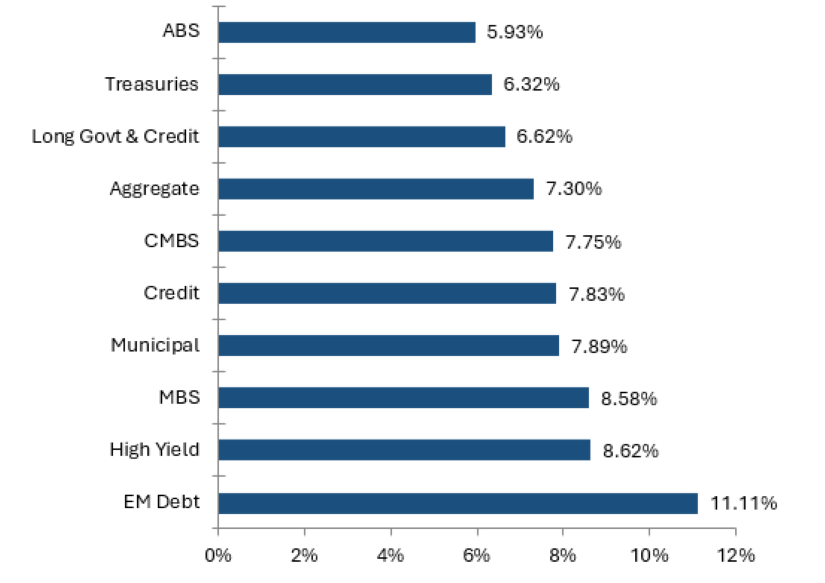
Source: Bloomberg Data as 12/31/25
EQUITY MARKETS
A defining theme of the 2025 equity market has been AI. The AI-related optimism fueled a powerful rally throughout the year, evident in the widening performance gap between the S&P 500 Index (SPX) and the S&P 500 Equal Weight Index (SPW).40 The market’s gains were driven predominantly by a narrow group of mega-cap companies with heavy exposure to AI infrastructure, research and monetization. This concentration is further evident in sector leadership: communication services, information technology, industrials and utilities (surprisingly), whose strong performance was tied to data center power demand.41 Yet the AI narrative has not followed a straight upward path. Earlier in the year, DeepSeek’s news from China rattled investor confidence, briefly halting the sector’s momentum. More recently, the attention has shifted to concerns about the sustainability and profitability of surging AI capital expenditures.
Equity markets did not escape the volatility surrounding Liberation Day, which proved to be one of the most disruptive equity events of 2025.42 The sudden repricing spilled across sectors and factors, leading to some of the year’s widest intraday trading ranges. The Chicago Board Options Exchange Volatility Index (VIX) surged to levels comparable to those seen during COVID-19.43 While markets ultimately stabilized, the episode underscored the market fragility in an environment shaped by policy uncertainty, geopolitical tensions and leveraged positioning.
Despite these sources of volatility, corporate earnings delivered a solid foundation for equity markets. The first three quarters of 2025 posted double-digit year-over-year earnings growth, marking one of the most consistent earnings expansions in the post-pandemic cycle.44 Once again, the largest contributions came from firms connected to AI, digital infrastructure and productivity-enhancing technologies. The earnings backdrop helped support investor confidence even as macroeconomic uncertainty fluctuated.
Beyond the U.S, international markets also enjoyed a strong year.45 Both developed markets ex-U.S. and emerging markets recorded solid gains, benefiting from improving economic conditions, easing inflation pressures and strong global demand for semiconductor-related exports.46 Markets with meaningful exposure to the global AI supply chain, particularly in East Asia, performed especially well.47
Exhibit 2. 2025 Financial Market Performance
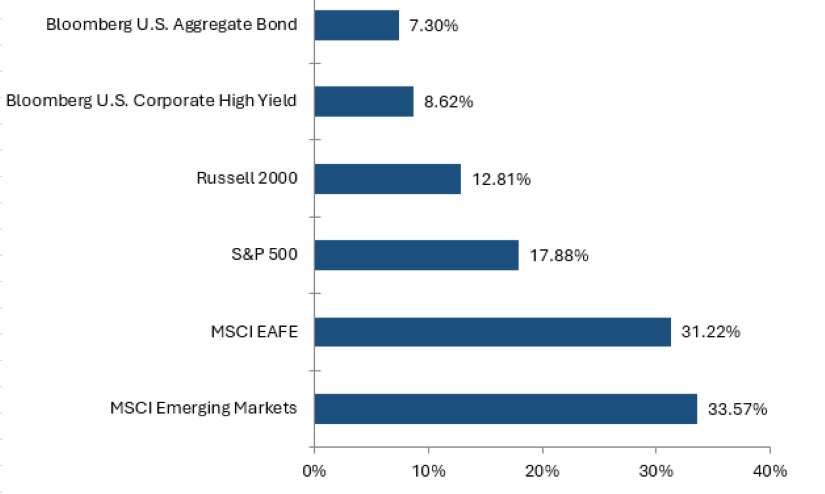
Source: Bloomberg Data as 12/31/25
Now that 2025 has come to an end, what can investors expect in 2026? Be sure to check back later this week for our 2026 Economic and Capital Markets Outlook.
Sources:
1Board of Governors of the Federal Reserve System – Summary of Economic Projections; 12/10/25
2Stifel – Trade Policy Clarity, Economic Uncertainty: The Investment Implications of President Trump’s “Liberation Day;” 4/4/25
3Board of Governors of the Federal Reserve System – Transcript of Chair Powell’s Press Conference December 10, 2025
4FitchRatings – U.S. Consumer Spending to Weaken as Tariffs Slow Growth in 2H25; 6/17/25
5U.S. Bureau of Labor Statistics – Current Employment Statistics Preliminary Benchmark (National) Summary; 9/9/25
6U.S. Bureau of Labor Statistics – Civilian unemployment rate; as of November 2025
7CNBC – Delayed September report shows U.S. added 119,000 jobs, more than expected; unemployment rate at 4.4%; 11/20/25
8,9U.S. Bureau of Labor Statistics – Total nonfarm payroll employment changed little in November 2025; 12/22/25
10,11Bureau of Labor Statistics – Consumer Price Index – November 2025; 12/18/25
12,13Morningstar – What’s Next for the Fed in 2026? 1/6/26
14Federal Reserve Bank of New York – Statement Regarding Reserve Management Purchases Operations; 12/10/25
15NBC News – Federal Reserve cuts key interest rate in bid to boost job market; 10/29/25
16PBS News – The government shutdown will impact an already-struggling economy, from lost paychecks to canceled flights; 11/11/25
17,20,23Moody’s – Moody's Ratings downgrades United States ratings to Aa1 from Aaa; changes outlook to stable; 5/16/25
18BNY – Moody's Downgrade of the U.S. Credit Rating; May 2025
19France 24 – Moody’s downgrade amid rising debt intensifies fears over US fiscal future; 5/19/25
21,25,26Congressional Budget Office – Monthly Budget Review: Summary for Fiscal Year 2025; 11/10/25
22,24House Budget Committee – Congressional Budget Office Updates Baseline: Deficit Totals to Third Highest in American History
27Committee for a Responsible Federal Budget – Permanent House Tax Cuts Come with $5.2 Trillion Price Tag; 6/4/25
28-30,33-38,40,42,45-47Bloomberg
31CNBC – 10-Year U.S. Treasury; as of January 2026
32Federal Reserve Bank of Philadelphia – In Final Speech as Philadelphia Fed President, Harker Calls for Continued “Deliberate” Actions as Economic Uncertainties Remain; 6/5/25
39J.P.Morgan – Gap Between Leveraged Loan and High-Yield Bond Default Rates Narrowed 203bp in 2025 Off a High Since 2000; 1/5/26
41Park Avene Securities – Monthly Market Commentary – January 2026
43CNBC – The Chicago Board Options Exchange Volatility Index (VIX); as of January 2026
44J.P.Morgan – 3Q25 Earnings: Tech boom or bust?; 11/5/25
Index Definitions:
Bloomberg U.S. Aggregate ABS Total Return Index – An index that is the ABS component of the U.S. Aggregate Index and has three subsectors: credit and charge cards, autos and utility. The index includes pass-through, bullet and controlled amortization structures and includes only the senior class of each ABS issue and the ERISA-eligible B and C tranche.
Bloomberg U.S. Aggregate Bond Index – An index that is a broad-based flagship benchmark that measures the investment grade, U.S. dollar-denominated, fixed-rate taxable bond market. The index includes Treasuries, government-related and corporate securities, MBS (agency fixed-rate pass-throughs), ABS and CMBS (agency and non-agency).
Bloomberg U.S. CMBS Index – An Index that measures the investment-grade market of U.S. Agency and U.S. Non-Agency conduit and fusion CMBS deals with a minimum current deal size of $300mm that are ERISA eligible.
Bloomberg U.S. Corporate High Yield Bond Index – An index that measures the USD-denominated, high yield, fixed-rate corporate bond market.
Bloomberg U.S. Credit Index – An index that measures the investment grade, U.S. dollar-denominated, fixed-rate, taxable corporate and government-related bond markets.
Bloomberg Emerging Markets USD Aggregate Index – A flagship hard currency Emerging Markets debt benchmark that includes fixed and floating-rate U.S. dollar-denominated debt issued from sovereign, quasi-sovereign and corporate EM issuers.
Bloomberg U.S. Long Government/Credit Index – An index that is a broad-based flagship benchmark that measures the non-securitized component of the U.S. Aggregate Index with 10 or more years to maturity. The index includes investment grade, U.S. dollar-denominated, fixed-rate treasuries, government-related and corporate securities.
Bloomberg U.S. Mortgage-Backed Securities (MBS) Index – An index that tracks agency mortgage-backed pass-through securities (both fixed-rate and hybrid ARM) guaranteed by Ginnie Mae (GNMA), Fannie Mae (FNMA) and Freddie Mac (FHLMC).
Bloomberg U.S. Municipal Index – An index that covers the USD-denominated long-term tax exempt bond market. The index has four main sectors: state and local general obligations bonds, revenue bonds, insured bonds and prerefunded bonds.
Bloomberg U.S. Treasury Index – An index that measures U.S. dollar-denominated, fixed-rate, nominal debt issued by the U.S. Treasury.
MSCI EAFE Index – An index that is designed to measure the equity market performance of developed markets outside of the U.S. & Canada.
MSCI Emerging Markets Index – A free float-adjusted market capitalization index that is designed to measure equity market performance in the global emerging markets.
Russell 2000 Index – An index measuring the performance of approximately 2,000 small cap companies in the Russell 3000 Index, which is comprised of 3,000 of the largest U.S. stocks.
S&P 500 Index – An index of 500 stocks chosen for market size, liquidity and industry grouping, among other factors. The S&P 500 is designed to be a leading indicator of U.S. equities and is meant to reflect the risk/return characteristics of the large cap universe.
All trademarks are the property of their respective owners.
Disclosures:
The views expressed in this material are the views of PMAM through the year ending December 31, 2025, and are subject to change based on market and other conditions. This material contains certain views that may be deemed forward-looking statements. The inclusion of projections or forecasts should not be regarded as an indication that PMAM considers the forecasts to be reliable predictors of future events. Any forecasts contained in this material are based on various estimates and assumptions, and there can be no assurance that such estimates or assumptions will prove accurate. Actual results may differ significantly.
Past performance is not indicative of future results. The views expressed do not constitute investment advice and should not be construed as a recommendation to purchase or sell securities. All information has been obtained from sources believed to be reliable, but accuracy is not guaranteed. There is no representation or warranty as to the accuracy of the information and PMAM shall have no liability for decisions based upon such information.
This material is for informational use only. The views expressed are those of the author, and do not necessarily reflect the views of Penn Mutual Asset Management. This material is not intended to be relied upon as a forecast, research or investment advice, and it is not a recommendation, offer or solicitation to buy or sell any securities or to adopt any investment strategy.
Opinions and statements of financial market trends that are based on current market conditions constitute judgment of the author and are subject to change without notice. The information and opinions contained in this material are derived from sources deemed to be reliable but should not be assumed to be accurate or complete. Statements that reflect projections or expectations of future financial or economic performance of the markets may be considered forward-looking statements. Actual results may differ significantly. Any forecasts contained in this material are based on various estimates and assumptions, and there can be no assurance that such estimates or assumptions will prove accurate.
Investing involves risk, including possible loss of principal. Past performance is no guarantee of future results. All information referenced in preparation of this material has been obtained from sources believed to be reliable, but accuracy and completeness are not guaranteed. There is no representation or warranty as to the accuracy of the information and Penn Mutual Asset Management shall have no liability for decisions based upon such information.
High-Yield bonds are subject to greater fluctuations in value and risk of loss of income and principal. Investing in higher yielding, lower rated corporate bonds have a greater risk of price fluctuations and loss of principal and income than U.S. Treasury bonds and bills. Government securities offer a higher degree of safety and are guaranteed as to the timely payment of principal and interest if held to maturity.
All trademarks are the property of their respective owners. This material may not be reproduced in whole or in part in any form, or referred to in any other publication, without express written permission.