An Absence of Fear
May 23, 2024
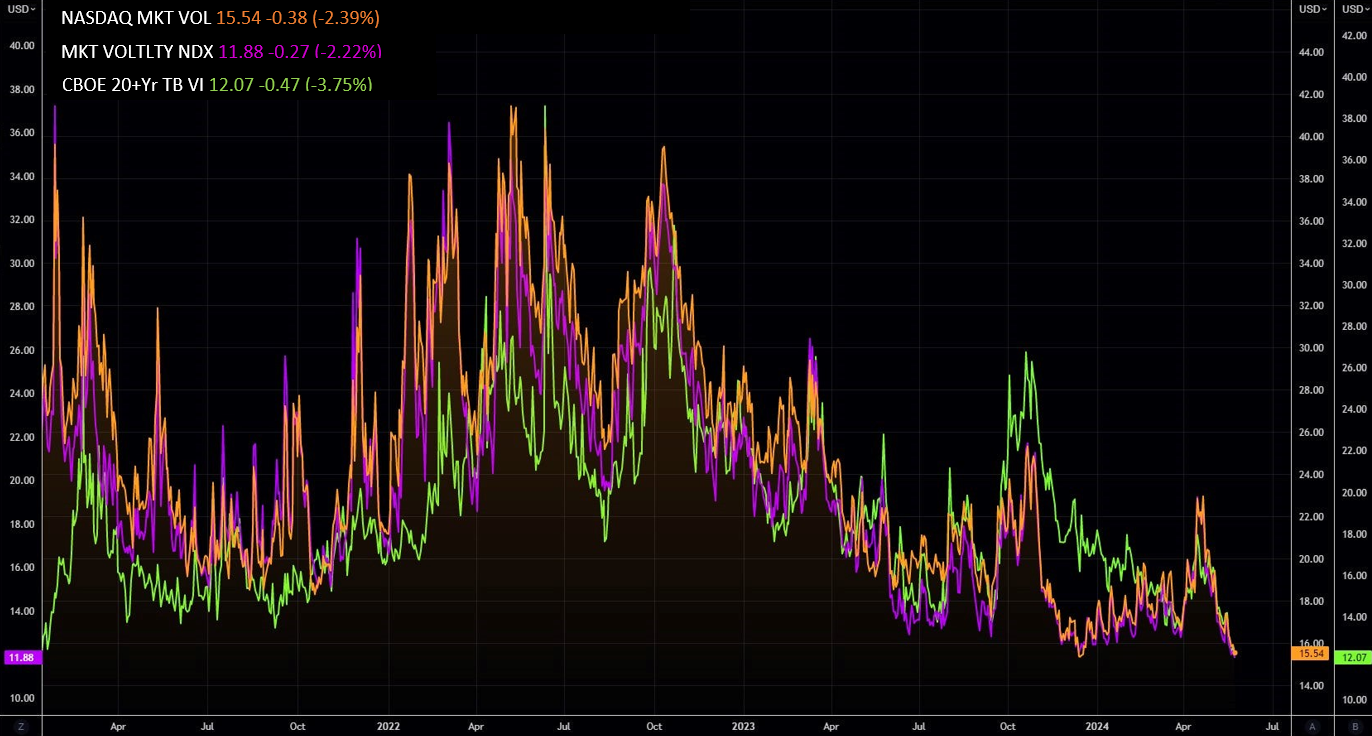.png "Source: Bloomberg")
Back in the day — “the day” being the late 1980s through the early 2000s — there was a very popular term associated with extreme sports and behavior: “No Fear!” It was a term of endearment for risk takers and a compliment to those who were willing to live life on the edge. In the stock and credit markets today, we can assess sentiment based on the varying levels of apparent fear and/or greed. These two factors, as it turns out, are a tale as old as time. While times are always changing, the factors usually stay exactly the same — human behavior (fear and greed) and their cycles. One of the key ways to observe the shifting markets is through sentiment indicators.
There are many ways to track the sentiment in the stock and bond markets beyond simple price levels. Prices are a great indicator, don’t get me wrong. However, to understand market behavior beyond the gradual upward trend of major index charts, a few other indicators can be helpful. Market valuations and credit spreads, the amount of fund flows into the markets, the number of short sellers in the market, how much off-index trading there may be and meme stock popularity are all helpful indicators. Currently, these indicators appear to be suggesting the same thing — the market has no fear!
The Chicago Board Options Exchange (CBOE) Volatility Index (VIX), commonly known as the fear index, measures the implied volatility of S&P 500 Index options and is front and center in terms of capturing this fearless dynamic today. Additionally, the CBOE NASDAQ Market Volatility Index (VXN) and CBOE 20+ Year Treasury Bond ETF Volatility Index (VXTLT) are both showing the same decline in volatility. After spiking during COVID-19 and a few other brief bouts of fear over the past few years, volatility has been squeezed out of the stock markets just as corporate bond spreads have grinded to near all-time tights in the credit market. Today’s Chart of the Week is a very good indicator of the more euphoric conditions we are currently experiencing — leading to a resurgence of speculative options trading and the second coming of the silliness of the meme-stock frenzy of 2021.
Now as an investor, this may seem great as some seem to be making money very easily. However, as a contrarian, it does give me a little sense of pause. On the plus side, earnings growth has been solid.1 Higher interest rates have been digested much better than many (myself included) expected by most large-cap companies. The latest inflation reading came in lower than expected which was a refreshing surprise, giving hope that the Federal Reserve just might be able to cut rates later this year.2 The hopes for a soft landing scenario could certainly be in play.
Nevertheless, we cannot let the good times result in complacency. Just because the market is not presently placing much value on downside risk does not mean that none exists. Looking ahead, a very important election cycle is on the horizon globally. There are some concerns about developments overseas, including trade issues with China and the lingering conflicts in Ukraine (with Russia) and in the Middle East. Under the surface of solid earnings for large-cap companies are smaller-cap and non-U.S. company results that are showing some wear and tear due to the persistence of higher for longer interest rates. And finally, from a big-picture perspective, what will the recent sharp rise in many important commodities such as gold, silver and copper mean for future inflation and the U.S. dollar? These are all important headline risks that the market will need to work through in the future.
Key Takeaway
As a contrarian, I must admit that I do love irony. The “No Fear” slogan was capitalized into a real-life American lifestyle clothing brand in 1989. The company soon enough grew sales to nearly $200 million at its peak.3 Life without fear was certainly very good, but as they say, most good things usually come to an end. In a press release posted in 2011, No Fear founder Mark Simo stated, “Due to the state of the economy and the difficult operating environment within our industry, the company needs to re-organize its finances and operations. We already have effected significant cost reductions and other changes to improve our business, including the closing of a number of under-performing stores.”4 The No Fear brand had succumbed to Chapter 11 bankruptcy.5 The lesson here: even if we have an absence of fear, we can also have an awareness that risk does not go away simply because fear is overcome by greed.
The world turns, cycles turn and identifying where we are amid these market shifts can be very profitable as long as you stay firmly grounded in solid economic reality.
Sources:
1FactSet – Earnings Insight; 5/17/24
2Reuters – US consumer prices rise less than expected in April; core CPI slows; 5/15/24
3-5Racer X – The Rise and Fall of No Fear; 5/10/19
Definitions:
The CBOE NASDAQ Market Volatility Index (VXN) is a measure of implied volatility, based on the prices of a basket of NASDAQ 100 Index options with 30 days to expiration.
The CBOE 20+ Year Treasury Bond ETF Volatility Index (VXTLT) is a measure of implied volatility, based on the prices of a basket of the iShares 20+ Year Treasury Bond ETF options with 30 days to expiration.
This material is for informational use only. The views expressed are those of the author, and do not necessarily reflect the views of Penn Mutual Asset Management. This material is not intended to be relied upon as a forecast, research or investment advice, and it is not a recommendation, offer or solicitation to buy or sell any securities or to adopt any investment strategy.
Opinions and statements of financial market trends that are based on current market conditions constitute judgment of the author and are subject to change without notice. The information and opinions contained in this material are derived from sources deemed to be reliable but should not be assumed to be accurate or complete. Statements that reflect projections or expectations of future financial or economic performance of the markets may be considered forward-looking statements. Actual results may differ significantly. Any forecasts contained in this material are based on various estimates and assumptions, and there can be no assurance that such estimates or assumptions will prove accurate.
Investing involves risk, including possible loss of principal. Past performance is no guarantee of future results. All information referenced in preparation of this material has been obtained from sources believed to be reliable, but accuracy and completeness are not guaranteed. There is no representation or warranty as to the accuracy of the information and Penn Mutual Asset Management shall have no liability for decisions based upon such information.
High-Yield bonds are subject to greater fluctuations in value and risk of loss of income and principal. Investing in higher yielding, lower rated corporate bonds have a greater risk of price fluctuations and loss of principal and income than U.S. Treasury bonds and bills. Government securities offer a higher degree of safety and are guaranteed as to the timely payment of principal and interest if held to maturity.
All trademarks are the property of their respective owners. This material may not be reproduced in whole or in part in any form, or referred to in any other publication, without express written permission.