
The S&P 500 Index Is Calm. Its Stocks Aren’t.
August 20, 2026
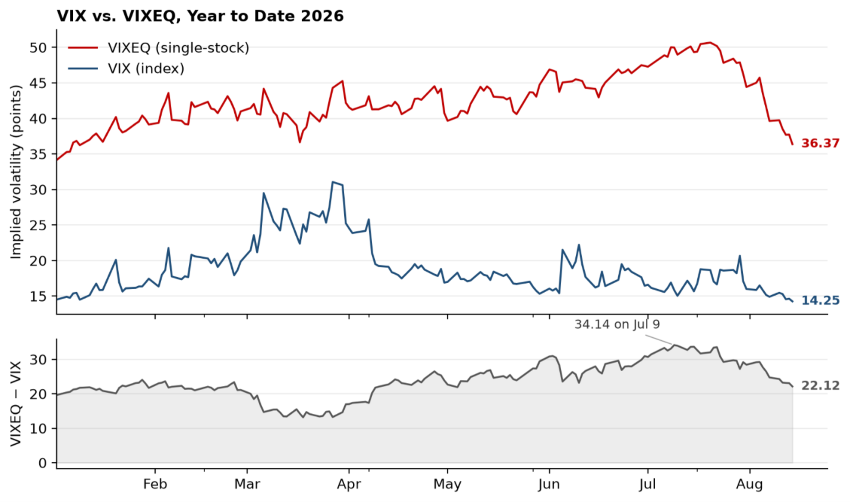
The gap between the Cboe Volatility Index (VIX), the market’s “fear gauge” that measures expected 30-day S&P 500 Index volatility, and the Cboe S&P 500 Constituent Volatility Index (VIXEQ), a measure of expected single-stock volatility, widened to an all-time high of 34.14 points on July 9.1 The record-setting spread reflected a combination of low correlation among index constituents and extreme single-stock volatility. Index volatility can stay suppressed while single-stock volatility soars because, mechanically, when correlation among stocks is low, stock movements can offset one another, reducing the magnitude of index-level moves. While the VIX closed at 15.84 on July 9, about four points below its long-run average of 19.60 (August 2006 – August 2026), the VIXEQ closed at 49.98, landing in the 98th percentile of observations since its inception in 2014.2
The spread has since narrowed by 12.02 points to 22.12 as single-stock volatility has retreated from extreme levels, though the VIXEQ remains modestly elevated relative to its long-run average of 31.56 (June 2014 – August 2026).3 The compression has been partially driven by volatility normalizing in semiconductors. Across the 10 largest stocks in the PHLX Semiconductor Sector Index (SOX) by weight, average three-month implied volatility has fallen nearly 20 points through Aug. 10.4 The decline in VIXEQ can also be attributed, in part, to the passing of earnings season, with 89% of companies having reported as of Aug. 10.5
Index volatility, on the other hand, has remained relatively subdued as correlations among individual stocks remain near historical lows. As of Aug. 14, the average 60-day pairwise correlation among S&P 500 Index stocks sat in the bottom 1% of observations since 2005, near the multiyear low reached in July.6 The decline is broad-based: correlation between stocks in different sectors sits in the 1st percentile of its history, and correlation between stocks in the same sector in the 3rd.7
Key Takeaway
Single-stock volatility has begun to normalize, and the VIXEQ – VIX spread continues to narrow from its record highs. Meanwhile, correlation among stocks remains near historical lows, though correlation can spike quickly. The S&P 500 Index looks quiet, but the stocks inside it are not. A macro shock that causes stocks to move together again would likely push index volatility higher, even if single-stock volatility continued to decline.8
Sources:
1-3,6,7Bloomberg
4Citadel Securities – August Checklist; 8/11/26
5Cboe Global Markets – Macro Volatility Digest; 8/10/26
8Bloomberg – Key S&P 500 Sectors Have Stopped Moving Together: Equity Insight; 7/13/26
This material is for informational use only. The views expressed are those of the author, and do not necessarily reflect the views of Penn Mutual Asset Management. This material is not intended to be relied upon as a forecast, research or investment advice, and it is not a recommendation, offer or solicitation to buy or sell any securities or to adopt any investment strategy.
Opinions and statements of financial market trends that are based on current market conditions constitute judgment of the author and are subject to change without notice. The information and opinions contained in this material are derived from sources deemed to be reliable but should not be assumed to be accurate or complete. Statements that reflect projections or expectations of future financial or economic performance of the markets may be considered forward-looking statements. Actual results may differ significantly. Any forecasts contained in this material are based on various estimates and assumptions, and there can be no assurance that such estimates or assumptions will prove accurate.
Investing involves risk, including possible loss of principal. Past performance is no guarantee of future results. All information referenced in preparation of this material has been obtained from sources believed to be reliable, but accuracy and completeness are not guaranteed. There is no representation or warranty as to the accuracy of the information and Penn Mutual Asset Management shall have no liability for decisions based upon such information.
High-Yield bonds are subject to greater fluctuations in value and risk of loss of income and principal. Investing in higher yielding, lower rated corporate bonds have a greater risk of price fluctuations and loss of principal and income than U.S. Treasury bonds and bills. Government securities offer a higher degree of safety and are guaranteed as to the timely payment of principal and interest if held to maturity.
All trademarks are the property of their respective owners. This material may not be reproduced in whole or in part in any form, or referred to in any other publication, without express written permission.