Private Equity's Unsold Backlog Keeps Growing as Exit Routes Narrow
October 22, 2026
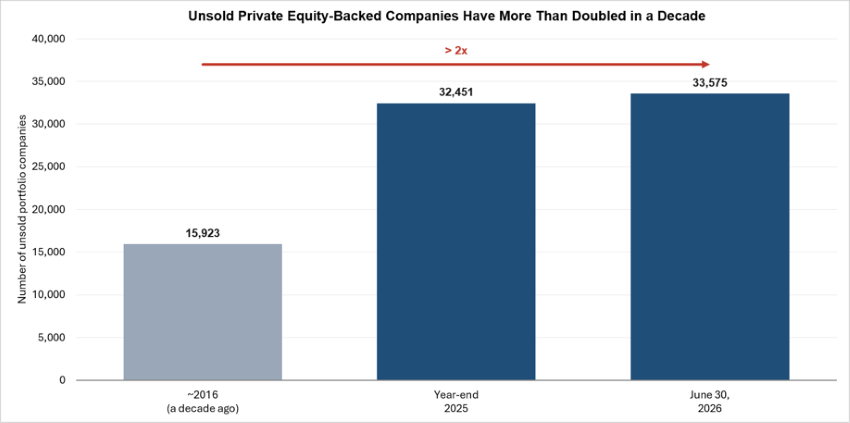
Private equity's (PE) inventory of unsold companies continues to climb. As of June 30, 2026, PitchBook Data, Inc. counted 33,575 PE-owned companies awaiting exit, up from 32,451 at year-end 2025 and more than double the 15,923 held a decade ago.1 Bain & Company's 2026 Global Private Equity Report estimated the value of unsold companies at approximately $3.8 trillion, up from about $3.6 trillion a year earlier.2,3 In the U.S. alone, PitchBook Data, Inc. counted 13,509 PE-backed companies at the end of the second quarter.4 Earlier this year, PitchBook Data, Inc. estimated that clearing the U.S. inventory at the current pace of exits would take roughly 11 years.5
The backlog is also aging. Bain reports that buyout holding periods at exit have stretched to around seven years, compared with five to six years between 2010 and 2021, and that almost 40% of portfolio companies have now been held for more than five years.6 PitchBook Data, Inc. estimates that general partners (GPs) hold more than $860 billion of buyout net asset value (NAV) in funds older than seven years.7 Many of these companies were acquired at peak multiples with inexpensive debt before the Federal Reserve’s 2022 rate hikes, leaving sponsors reluctant to sell below their marks and buyers unwilling to pay them.8
Exit channels have not offered much relief. Second-quarter exit value fell to roughly $100 billion, nearly half of the first quarter's level, and sales to other sponsors dropped almost 40% quarter-over-quarter to their lowest level in at least a decade.9 Activity is also concentrated at the top: exits of $1 billion or more totaled $63.2 billion across 23 transactions, more than 61% of the quarter's exit value.10 Premium assets can still clear, while smaller, more rate-sensitive companies wait. Initial public offerings (IPOs) have provided some help, accounting for about a third of second-quarter exit proceeds versus roughly 10% in the first quarter.11 Even so, only 70 PE-backed companies have gone public since 2022, versus more than 400 between 2017 and 2021.12
For limited partners (LPs), the consequence is a prolonged liquidity drought. Distributions as a share of NAV were roughly 14% in 2025, marking the fourth consecutive year below 15%, an industry record.13 GPs have responded with the tools we have discussed previously, including continuation vehicles and NAV financing. However, those tools defer exits rather than resolve them, and PitchBook Data, Inc. notes that nearly $500 billion in sponsor-backed loan maturities is concentrated in 2031 and 2032 alone, which limits how long deferrals can continue.14
Key Takeaway
The unsold-company backlog is no longer a short-term timing issue; it is a structural feature of today's PE market. For allocators, the question is less whether capital will eventually be returned than when, and at what valuation. Manager selection should weigh portfolio age, how marks compare with realistic exit values and a GP's track record of realizing assets, not just reporting gains.
Sources:
1,9,11,12Inc. – Private Equity Firms Are Sitting on Nearly 34,000 Unsold Companies; 8/10/26
2,6,13Bain & Company – Global Private Equity Report 2026; 2/23/26
3Bain & Company – Global Private Equity Report 2025; 3/3/25
4,10PitchBook Data, Inc. – U.S. PE Breakdown, Q2 2026; 7/6/26
5,8Yahoo Finance – Private Equity Is Struggling With Exits, Even as the AI Deal Boom Takes Over Wall Street; 6/29/26
7,14PitchBook Data, Inc. – Private Equity's Zombie Problem; 8/17/26
This material is for informational use only. The views expressed are those of the author, and do not necessarily reflect the views of Penn Mutual Asset Management. This material is not intended to be relied upon as a forecast, research or investment advice, and it is not a recommendation, offer or solicitation to buy or sell any securities or to adopt any investment strategy.
Opinions and statements of financial market trends that are based on current market conditions constitute judgment of the author and are subject to change without notice. The information and opinions contained in this material are derived from sources deemed to be reliable but should not be assumed to be accurate or complete. Statements that reflect projections or expectations of future financial or economic performance of the markets may be considered forward-looking statements. Actual results may differ significantly. Any forecasts contained in this material are based on various estimates and assumptions, and there can be no assurance that such estimates or assumptions will prove accurate.
Investing involves risk, including possible loss of principal. Past performance is no guarantee of future results. All information referenced in preparation of this material has been obtained from sources believed to be reliable, but accuracy and completeness are not guaranteed. There is no representation or warranty as to the accuracy of the information and Penn Mutual Asset Management shall have no liability for decisions based upon such information.
High-Yield bonds are subject to greater fluctuations in value and risk of loss of income and principal. Investing in higher yielding, lower rated corporate bonds have a greater risk of price fluctuations and loss of principal and income than U.S. Treasury bonds and bills. Government securities offer a higher degree of safety and are guaranteed as to the timely payment of principal and interest if held to maturity.
All trademarks are the property of their respective owners. This material may not be reproduced in whole or in part in any form, or referred to in any other publication, without express written permission.