Trends in Taxpayer AGI Migration
May 18, 2023

Migration within the U.S. can occur for many reasons. For some, it could be a job opportunity. For others, it might be for housing, to be closer to family or even just for better weather. With the increased availability of remote work, the consideration of state taxes is gathering increased attention as a possibly meaningful driver of taxpayer migration.
The Internal Revenue Service (IRS) recently released its migration data for returns received in 2021, which primarily reflect earnings in 2020. The data reveals net losses in adjusted gross income (AGI) from high-tax states, with low-tax states reaping a meaningful portion of the gains. This is not a new development, but rather a trend that emerged in recent years and has only accelerated.
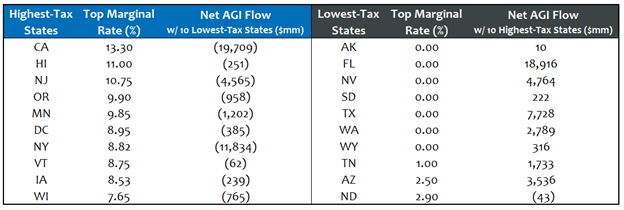
Today’s Chart of the Week shows the 10 states with the highest marginal tax rates and their net AGI flows to the 10 states with the lowest marginal tax rates. High-tax states like California, New Jersey and New York had large AGI outflows, while low-tax states like Florida, Nevada, Texas and Arizona were the primary beneficiaries.
California’s total net outflows reached $29 billion, with almost 70% of that amount going to the 10 lowest-tax states. New Jersey saw $4.6 billion migrate to low-tax states, but also gained $3.2 billion from the highest-tax states — with almost all of this net gain coming from New York.
The IRS report was also revealing in regard to the taxpayer average AGI that migrated. The average AGI of the taxpayers who migrated from New Jersey to Florida was $205K, while the average for taxpayers going from Florida to New Jersey was $89K. Meanwhile, the New York-to-Florida average AGI was $223K and the Florida-to-New York average was $67K.
Similarly, the average AGI of migrants from California to Texas was $136K, with the Texas-to-California average being $75K. The California-to-Nevada average AGI was $167K and the Nevada-to-California average was $54K. According to the IRS data, higher AGI taxpayers are clearly leaving higher-tax states and going to lower-tax states.
Key Takeaway
People relocate for a number of reasons. Given the current work-from-anywhere environment, the increasing migration of AGI from high-tax states to low-tax states has state leaders taking note. Admittedly, while this trend is concerning, the 2020 total net AGI outflows for states like California and New York amounted to only about 2% of each state’s AGI.
Although the most recent data comes from 2020, many agree that this AGI migration to low-tax states has continued since then and even accelerated. At this point, the migration has not significantly impacted most municipal credits, but it deserves to be monitored for the long-term impacts on state economic growth and resultant effects on the respective tax bases.
This material is for informational use only. The views expressed are those of the author, and do not necessarily reflect the views of Penn Mutual Asset Management. This material is not intended to be relied upon as a forecast, research or investment advice, and it is not a recommendation, offer or solicitation to buy or sell any securities or to adopt any investment strategy.
Opinions and statements of financial market trends that are based on current market conditions constitute judgment of the author and are subject to change without notice. The information and opinions contained in this material are derived from sources deemed to be reliable but should not be assumed to be accurate or complete. Statements that reflect projections or expectations of future financial or economic performance of the markets may be considered forward-looking statements. Actual results may differ significantly. Any forecasts contained in this material are based on various estimates and assumptions, and there can be no assurance that such estimates or assumptions will prove accurate.
Investing involves risk, including possible loss of principal. Past performance is no guarantee of future results. All information referenced in preparation of this material has been obtained from sources believed to be reliable, but accuracy and completeness are not guaranteed. There is no representation or warranty as to the accuracy of the information and Penn Mutual Asset Management shall have no liability for decisions based upon such information.
High-Yield bonds are subject to greater fluctuations in value and risk of loss of income and principal. Investing in higher yielding, lower rated corporate bonds have a greater risk of price fluctuations and loss of principal and income than U.S. Treasury bonds and bills. Government securities offer a higher degree of safety and are guaranteed as to the timely payment of principal and interest if held to maturity.
All trademarks are the property of their respective owners. This material may not be reproduced in whole or in part in any form, or referred to in any other publication, without express written permission.

