Running Out of Breadth
June 8, 2023

So far in 2023, the equity market has been surprisingly resilient. Through May 31, the S&P 500 Index has produced a total return of 9.64% for the year. This solid return comes despite continued Federal Reserve tightening, multiple bank failures, overwhelmingly negative investor sentiment and continued uncertainty about the economic outlook.
One contributor to this strength has been shrinking market breadth, which allows fewer and fewer stocks to dominate the returns of the index. In today’s Chart of the Week, I will examine the causes of the shrinking breadth as well as what this may mean for forward returns.
Market breadth is a way of describing how many stocks in an index are participating in a given move in either direction. If the index is advancing and all of the underlying stocks are also advancing, we would say that breadth is currently wide. On the flip side, if an advance in the index is being driven by a few stocks, we would say breadth is currently narrow.
Since indices tend to be weighted by market capitalization, periods of outperformance by certain sectors or companies can lead to declining breadth. This dominance of a few companies has come to define several recent time periods, exemplified by mega-cap tech companies such as Apple, Google, Microsoft, etc. being able to dictate the direction of the S&P 500 Index.
Today’s chart shows a measure of breadth from January 2010 through May 2023. The measure chosen is the ratio of the S&P 100 Index to the S&P 500 Index. When this measure is low, breadth is considered wider, as the price of the S&P 100 Index is a smaller percentage of the broader index. Currently, we are sitting at extraordinarily high levels of this measure, indicating extremely narrow index breadth. The question is — how did we get here and what could it mean for forward returns?
Narrowing breadth in 2023 has been driven by two separate narratives that have benefited the same companies in the index. Coming into this year, there was a consensus view that the economy was weakening and recession would soon follow. Accordingly, many investors began to reposition into higher-quality equities that had the balance sheets to weather a recession.
This repositioning greatly benefited mega-cap tech names, which have come to offer steady, solid growth as well as leadership in an industry that has become essential in the day-to-day lives of millions of people. As a result, market breadth started to narrow, as the largest companies in the index reaped most of the reward from this repositioning.
The second catalyst has been the hype around artificial intelligence (AI) since the release of ChatGPT in November 2022.1 Recently, all things AI have prospered. Nvidia, which makes the powerful chips preferred by AI companies, has seen its market cap reach nearly $1 trillion over the course of this year.2 Google and Microsoft, both large benefactors of the AI boom, have seen their already mega market caps swell even larger. All of this combined has resulted in the extremely narrow breadth in the S&P 500 Index.
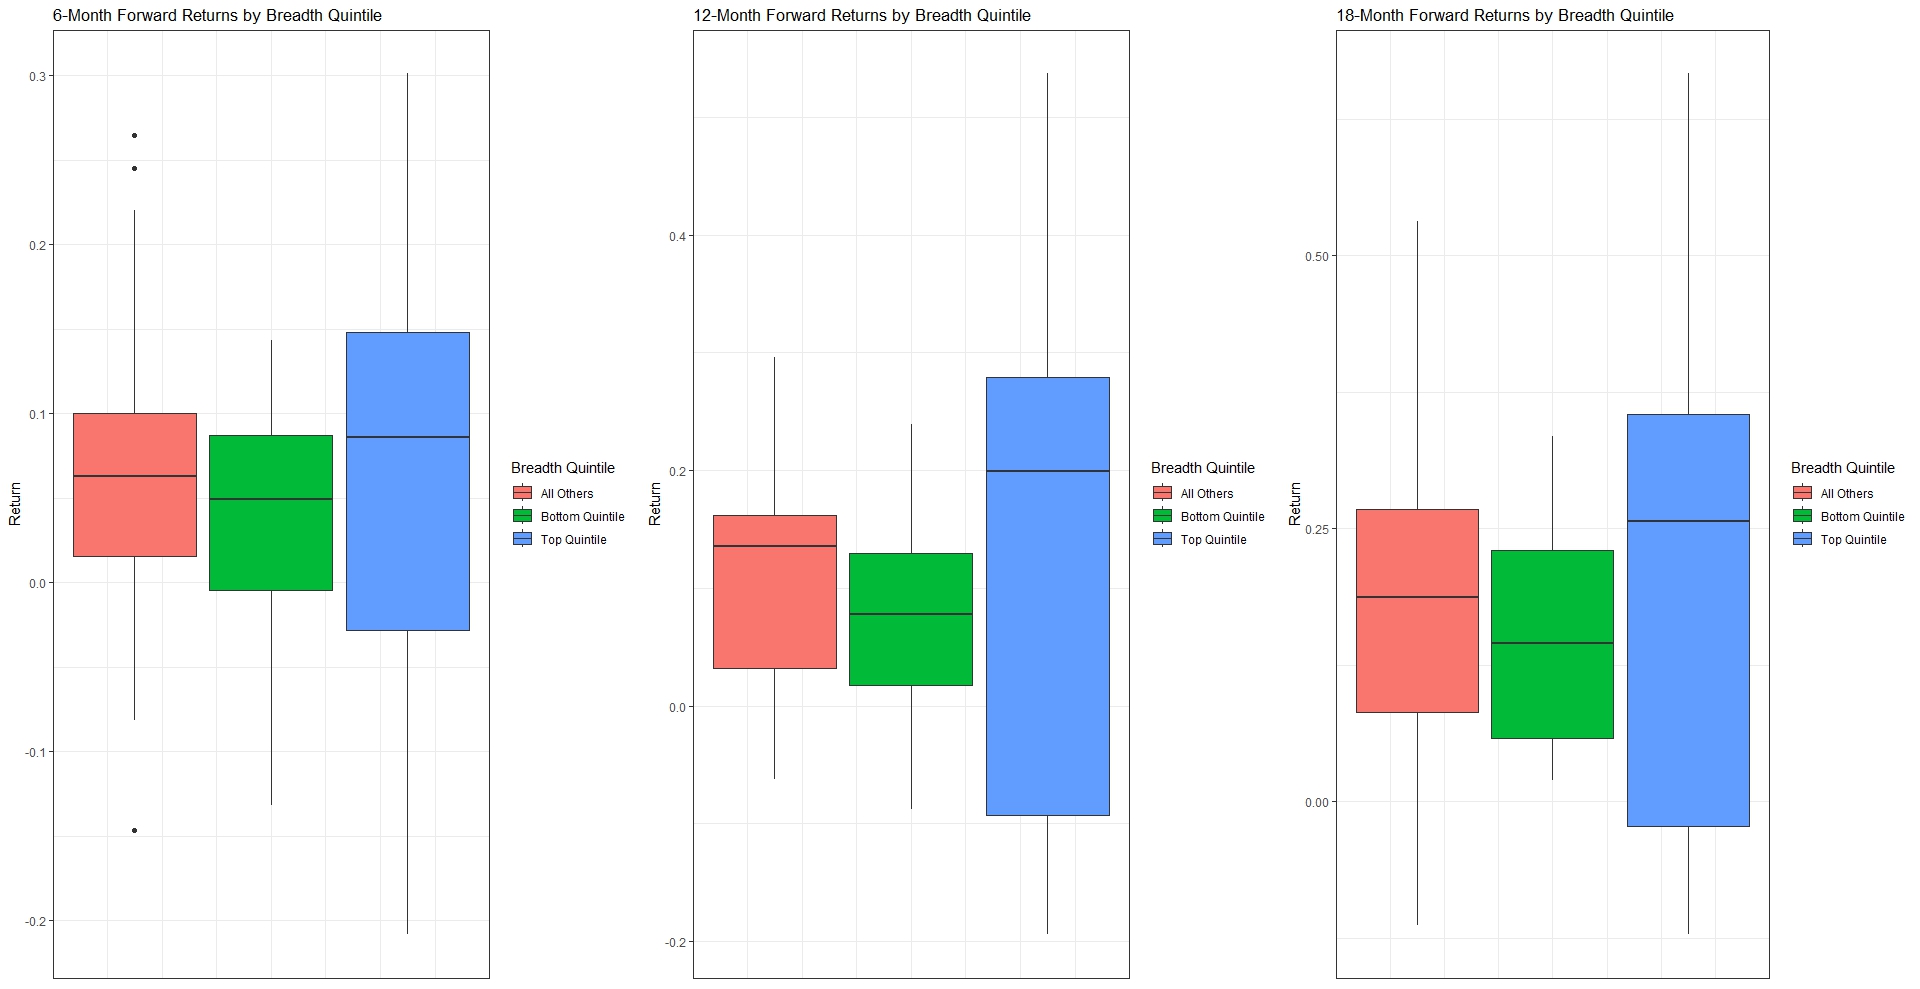
So what can we say about forward returns when breadth is at extremes? There are three boxplots shown below. These demonstrate the range of forward returns of the S&P 500 Index when breadth is in its top (blue) and bottom (green) quintiles, as well as all other times (red). Here, the top quintile means that breadth is at its narrowest, while the bottom quintile has breadth at its widest.
When looking at six-, 12- and 18-month horizons, market breadth at extreme narrows leads to much greater dispersion in forward returns. However, it does not necessarily always lead to negative forward returns. In fact, quite the opposite. Many of the highest forward index returns in the sample have come when breadth is at extreme narrows.
A good example of this is the post-COVID equity bubble. As seen in this week’s chart, breadth was extremely narrow, yet equities kept moving up. Eventually, we did see a correction in 2022, but it’s clear that breadth can stay narrow and elevated asset pricing can drive the index for long periods of time.
Overall, extremely narrow levels of breadth seem to result in markets with higher median forward returns but fatter tails. These are the types of markets that result in extreme outcomes. On the other extreme, when breadth is wide, we see markets with more tightly distributed forward returns and lower median forward returns. Wide breadth seems to take some probability out of the tails when it comes to forward returns.
Key Takeaway
Market breadth for the S&P 500 Index is extremely narrow. It currently sits in the 99th percentile when looking at data since 2010 and is at levels not seen since 2020. Recession fears and the current boom in all things AI have brought investment to the same mega-cap tech names simultaneously, allowing them to dominate the index.
While narrow breadth has been an indicator of increased dispersion in forward returns, it hasn’t necessarily indicated that negative returns were just around the corner. Concentration can serve as an indicator of frothy pricing at the top of the stack but seems to give no indication in terms of timing. If the past is any indication, narrow breadth tends to result in a fatter-tailed distribution of forward returns on multiple time horizons. The trick is, without a crystal ball, it’s impossible to know which tail you will get.
Sources:
1Business Insider – ChatGPT and Generative AI: Our Guide to 2023's Most Talked-About Technology; 5/12/2023
2CNN Business – Fueled by AI, Nvidia joins the $1 trillion club; 5/31/2023
This material is for informational use only. The views expressed are those of the author, and do not necessarily reflect the views of Penn Mutual Asset Management. This material is not intended to be relied upon as a forecast, research or investment advice, and it is not a recommendation, offer or solicitation to buy or sell any securities or to adopt any investment strategy.
Opinions and statements of financial market trends that are based on current market conditions constitute judgment of the author and are subject to change without notice. The information and opinions contained in this material are derived from sources deemed to be reliable but should not be assumed to be accurate or complete. Statements that reflect projections or expectations of future financial or economic performance of the markets may be considered forward-looking statements. Actual results may differ significantly. Any forecasts contained in this material are based on various estimates and assumptions, and there can be no assurance that such estimates or assumptions will prove accurate.
Investing involves risk, including possible loss of principal. Past performance is no guarantee of future results. All information referenced in preparation of this material has been obtained from sources believed to be reliable, but accuracy and completeness are not guaranteed. There is no representation or warranty as to the accuracy of the information and Penn Mutual Asset Management shall have no liability for decisions based upon such information.
High-Yield bonds are subject to greater fluctuations in value and risk of loss of income and principal. Investing in higher yielding, lower rated corporate bonds have a greater risk of price fluctuations and loss of principal and income than U.S. Treasury bonds and bills. Government securities offer a higher degree of safety and are guaranteed as to the timely payment of principal and interest if held to maturity.
All trademarks are the property of their respective owners. This material may not be reproduced in whole or in part in any form, or referred to in any other publication, without express written permission.