Implied Volatility May Be Low, But Is It Cheap?
January 4, 2024

As we begin 2024, I find myself reflecting on the dynamics the equity index options markets experienced in 2023. After a turbulent 2022 driven by macroeconomic volatility, 2023 generally saw implied volatility drift lower throughout the year. As evidence, the Chicago Board Options Exchange Volatility Index (VIX) averaged 16.85 and closed at 12.45. This compares with the 10-year average level of 18.13. In today’s Chart of the Week, I will examine some of the drivers of the move lower in implied volatility, as well as whether this low level actually implies that volatility is cheap.
Today’s chart examines the S&P 500 Index (SPX) volatility through two lenses — implied and realized. The implied volatility shows what the options market is pricing when a 1-month at the money (ATM) option is traded. The realized volatility uses the actual moves experienced by the index to calculate what volatility was over a 1-month time period. The key distinction between the two measures is that implied volatility is a forward-looking measure that can be considered the market’s best guess about the future. Conversely, realized volatility is a backward-looking measure that tells us what has already happened.
It can be seen in today’s chart that implied volatility mostly followed realized lower as the year progressed. There were a few spikes upward in implied volatility, notably around the time of the collapse of Silicon Valley Bank and the anxiety in October around the level of US debt. But reliably, as volatility failed to realize, implied drifted lower. Low realized volatility throughout the year was a function of the low breadth, slow grind-up that was experienced. Low realized volatility environments also tend to favor option selling strategies, which can further depress implied volatility as selling pressure outpaces buying interest.
However, is implied volatility a cheap buy just because it is at a low level? The answer to this question tends to be no, and this was especially the case in 2023. One way to answer this question is by looking at both the theoretical and realized volatility risk premium (VRP) present in the market at any given time. The VRP describes the amount of implied volatility in the options market trades above or below the actual level of volatility realized.
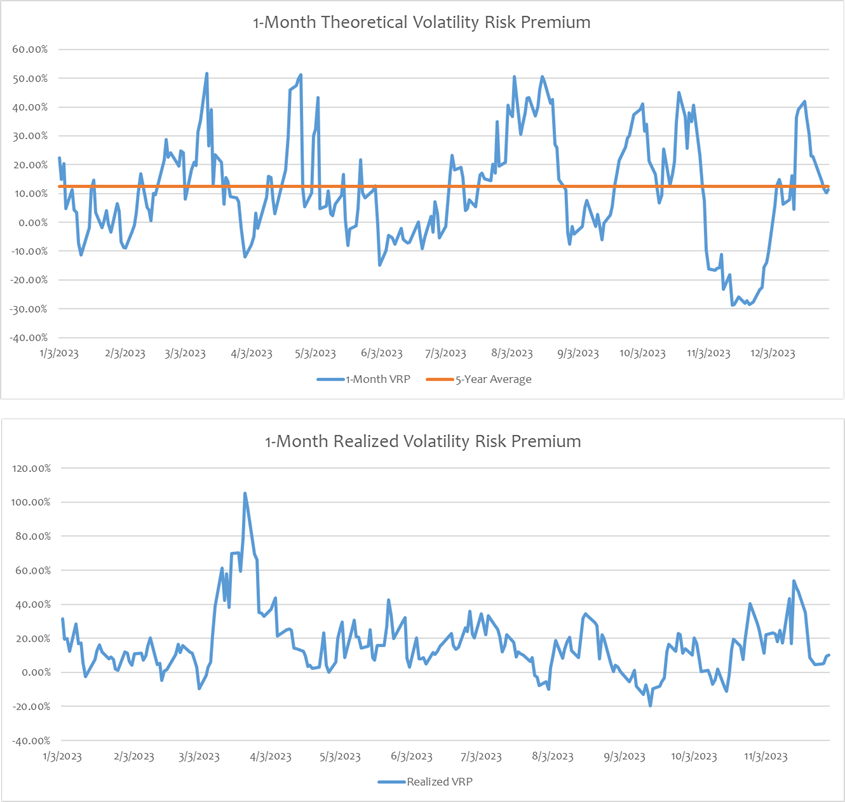
The theoretical VRP can be thought of as a pre-trade evaluation that compares the current level of implied volatility to the backward-looking realized volatility. Generally, this number is positive, given that implied volatility is forward-looking and options dealers need to warehouse the risk associated with selling options. Since option selling is a limited reward, unlimited risk endeavor, some premium will typically be demanded above realized volatility to facilitate trading. Implied volatility may also be priced upward to account for events, such as earnings reports or economic data releases, which backward-looking realized volatility does not capture. However, this amount fluctuates like any other price in the market. The first chart below shows where the theoretical VRP traded compared to its 5-year average in 2023. The VRP was mostly positive and persistently high compared to its 5-year average. While there were periods of negative VRP indicating times that volatility was cheap to buy, implied volatility predominantly screened as expensive last year.
Theoretical VRP is a great measure for trade evaluation, but what really matters is the volatility subsequently realized in the market compared to the level traded in the options market. This describes the realized VRP. It can be seen in the second chart below that this was also persistently positive throughout 2023, showing that the volatility being paid for in the options market was persistently higher than the volatility the market provided. As a result, volatility selling strategies performed well during the year.
Currently, the theoretical VRP is around its 5-year average. Volatility is not screaming as rich or cheap. However, this can fluctuate quite a bit over the course of a trading year.
Source: Bloomberg
Key Takeaway
Although implied volatility was persistently low during 2023, this does not mean that it was cheap. The measures of VRP discussed above show that volatility was actually expensive to buy in the options market compared to what was realized during the year. When trading options, careful attention should be paid to the VRP when deciding whether to buy or sell options. Even if the option trade is directional, exposure to volatility will impact the gain and loss on positions. Trades can be structured to have different volatility exposures while still taking the same directional exposure. For example, buying a call option is long the underlying while also being long volatility; selling a put is long the underlying while also being short volatility. Taking the relative cheapness or richness of volatility into account should inform the best way to express a directional view when using options.
This material is for informational use only. The views expressed are those of the author, and do not necessarily reflect the views of Penn Mutual Asset Management. This material is not intended to be relied upon as a forecast, research or investment advice, and it is not a recommendation, offer or solicitation to buy or sell any securities or to adopt any investment strategy.
Opinions and statements of financial market trends that are based on current market conditions constitute judgment of the author and are subject to change without notice. The information and opinions contained in this material are derived from sources deemed to be reliable but should not be assumed to be accurate or complete. Statements that reflect projections or expectations of future financial or economic performance of the markets may be considered forward-looking statements. Actual results may differ significantly. Any forecasts contained in this material are based on various estimates and assumptions, and there can be no assurance that such estimates or assumptions will prove accurate.
Investing involves risk, including possible loss of principal. Past performance is no guarantee of future results. All information referenced in preparation of this material has been obtained from sources believed to be reliable, but accuracy and completeness are not guaranteed. There is no representation or warranty as to the accuracy of the information and Penn Mutual Asset Management shall have no liability for decisions based upon such information.
High-Yield bonds are subject to greater fluctuations in value and risk of loss of income and principal. Investing in higher yielding, lower rated corporate bonds have a greater risk of price fluctuations and loss of principal and income than U.S. Treasury bonds and bills. Government securities offer a higher degree of safety and are guaranteed as to the timely payment of principal and interest if held to maturity.
All trademarks are the property of their respective owners. This material may not be reproduced in whole or in part in any form, or referred to in any other publication, without express written permission.