Mid-Year Economic and Capital Markets Review & Outlook
July 16, 2025

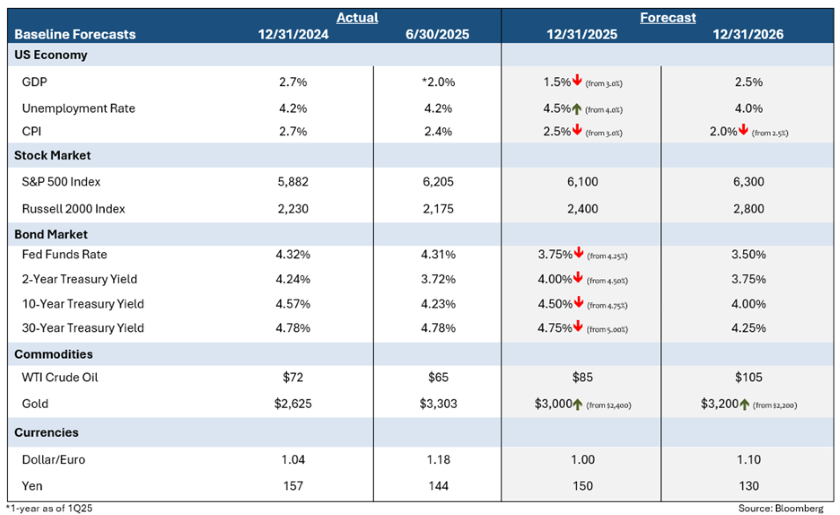
Mid-Year Review
Uncertainty created by new government policy initiatives proposed by the Trump administration dominated economic and financial news headlines during the first half of 2025. “Liberation Day” on April 2 marked the peak of this uncertainty when President Trump announced more severe trade tariffs than almost anyone had imagined. The negative impact on the financial markets was immediate, as the S&P 500 Index sold off sharply and quickly approached bear market territory.1
The long-running bull market in credit also began derailing, as bond investors turned more cautious regarding the economic disruption associated with new tariffs. Investment-grade (IG) corporate spreads underperformed duration-matched Treasuries for three consecutive months beginning in February while high-yield corporate bond spreads widened by approximately 200 basis points.2
As the economic and market outlook appeared bleakest in late April, President Trump’s decision to scale back the most extreme tariff measures fueled a market rebound as swift and strong as the sell-off. The S&P 500 Index closed the second quarter at a record high,3 while IG credit spreads approached the historically tight spread levels witnessed at the beginning of the year.4
Although U.S. economic growth can still be viewed as resilient, first-quarter gross domestic product (GDP) contracted by an annualized rate of -0.5% — the first quarterly decline in three years.5 Weaker consumer spending and front-loading of imports in advance of “Liberation Day” contributed to the decline. Despite mounting signs of stress among income-constrained consumer segments, U.S. consumer spending continues to be supported by low unemployment and household wealth at record highs.
The U.S. housing market remains the sector most challenged by the high-interest-rate environment after a prolonged period of record low mortgage rates. The lack of new housing supply — partially from existing homeowners “locked-in” to low mortgage rates — has kept home prices elevated. Housing affordability measures are near the most challenging on record, especially for first-time homebuyers.
Outlook
Consistent with the themes from our 2024 mid-year interest rate outlook, the Federal Reserve (Fed) will likely resume interest rate cuts during the second half of the year. Still, the outlook for longer-term bonds may be more challenging.
Longer-term rates will likely remain elevated with no end in sight to high U.S. government deficits and debt. The recently passed One Big Beautiful Bill Act will create front-loaded tax and spending benefits while delaying the measures to pay for them. Bond investors concerned that President Trump will appoint an overly dovish Fed Chair next year may also pressure the long end of the Treasury yield curve.
Equity and bond market volatility may subside during the second half of the year; however, economic and market uncertainty will always be present. The biggest lesson for equity and fixed-income investors from the volatility witnessed during the first half of 2025 is to stay the course and invest for the long term.
For timely perspectives on the economy, markets and investing, be sure to subscribe to our publications below.
Sources:
1Morningstar – Stock-market investors went from panic to 'Goldilocks.' Are they getting ahead of themselves?; 7/6/25
2,4Bloomberg
3CNBC – S&P 500 rises to another record to wrap up second-quarter comeback; 6/30/25
5CBS News – GDP data shows U.S. economy shrank more than previously thought in early 2025; 6/26/25
Index Definitions:
S&P 500 Index — An index of 500 stocks chosen for market size, liquidity and industry grouping, among other factors. The S&P 500 is designed to be a leading indicator of U.S. equities and is meant to reflect the risk/return characteristics of the large-cap universe.
Russell 2000 Index — An index measuring the performance of approximately 2,000 small-cap companies in the Russell 3000 Index, which is comprised of 3,000 of the largest U.S. stocks.
All trademarks are the property of their respective owners.
Disclosures:
The views expressed in this material are the views of PMAM through the year ending June 30, 2025, and are subject to change based on market and other conditions. This material contains certain views that may be deemed forward-looking statements. The inclusion of projections or forecasts should not be regarded as an indication that PMAM considers the forecasts to be reliable predictors of future events. Any forecasts contained in this material are based on various estimates and assumptions, and there can be no assurance that such estimates or assumptions will prove accurate. Actual results may differ significantly.
Past performance is not indicative of future results. The views expressed do not constitute investment advice and should not be construed as a recommendation to purchase or sell securities. All information has been obtained from sources believed to be reliable, but accuracy is not guaranteed. There is no representation or warranty as to the accuracy of the information and PMAM shall have no liability for decisions based upon such information.
This material is for informational use only. The views expressed are those of the author, and do not necessarily reflect the views of Penn Mutual Asset Management. This material is not intended to be relied upon as a forecast, research or investment advice, and it is not a recommendation, offer or solicitation to buy or sell any securities or to adopt any investment strategy.
Opinions and statements of financial market trends that are based on current market conditions constitute judgment of the author and are subject to change without notice. The information and opinions contained in this material are derived from sources deemed to be reliable but should not be assumed to be accurate or complete. Statements that reflect projections or expectations of future financial or economic performance of the markets may be considered forward-looking statements. Actual results may differ significantly. Any forecasts contained in this material are based on various estimates and assumptions, and there can be no assurance that such estimates or assumptions will prove accurate.
Investing involves risk, including possible loss of principal. Past performance is no guarantee of future results. All information referenced in preparation of this material has been obtained from sources believed to be reliable, but accuracy and completeness are not guaranteed. There is no representation or warranty as to the accuracy of the information and Penn Mutual Asset Management shall have no liability for decisions based upon such information.
High-Yield bonds are subject to greater fluctuations in value and risk of loss of income and principal. Investing in higher yielding, lower rated corporate bonds have a greater risk of price fluctuations and loss of principal and income than U.S. Treasury bonds and bills. Government securities offer a higher degree of safety and are guaranteed as to the timely payment of principal and interest if held to maturity.
All trademarks are the property of their respective owners. This material may not be reproduced in whole or in part in any form, or referred to in any other publication, without express written permission.