The S&P 500 Index Is No Longer Calm, but Its Stocks Still Aren’t Moving Together
November 19, 2026
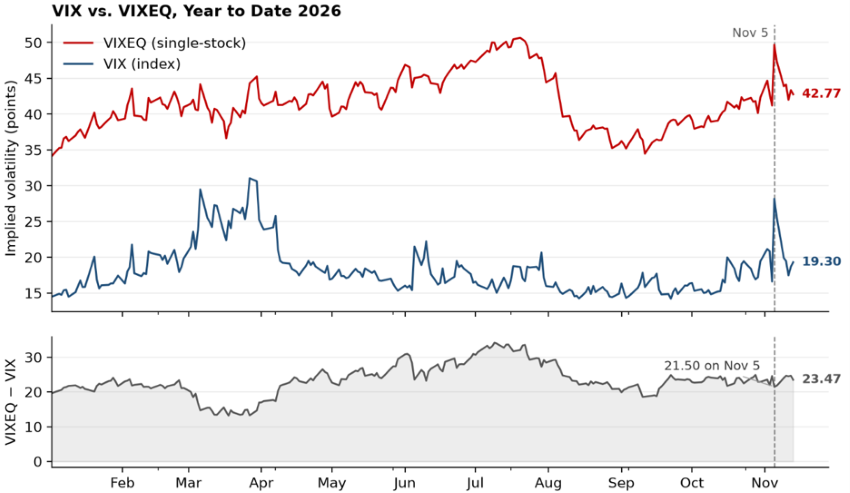
In my August Chart of the Week, I noted that the S&P 500 Index looked quiet while the stocks inside it did not, a gap that reflected very low correlation among its constituents. On Nov. 5, the second session after the midterm elections, the index was no longer quiet. A 4.36% decline left the S&P 500 Index at 7,353.73, and the Cboe Volatility Index (VIX) climbed from 16.61 to 28.18, a 69.66% increase that ranks as its third-largest one-day percentage gain since 1990.1 Tech stocks led the decline, which Cboe attributed to concerns about a slowdown in artificial intelligence (AI) capital spending.2
That day, index volatility rose much faster than single-stock volatility. The VIX climbed nearly 70%, while the Cboe S&P 500 Constituent Volatility Index (VIXEQ), a measure of expected single-stock volatility, rose 20.55%, from 41.21 to 49.68.3 The Cboe 1-Month Implied Correlation Index (COR1M), which measures the market’s expectation of average 1-month correlation among the S&P 500 Index’s top 50 stocks, more than doubled, from 9.53% to 22.84%.4 The VIXEQ-VIX spread narrowed only modestly, to 21.50 points, close to where it stood in mid-August, and widened again to 23.47 by Nov. 13.5
Even after more than doubling, correlation remained low for a decline of this size. According to Cboe, implied correlation levels have averaged closer to 70% on days with S&P 500 Index declines of similar magnitude over the past 20 years.6 Much of the move has since reversed. As of Nov. 13, the VIX stood at 19.30, and COR1M was 11.80%, far below its long-run average of 36.84% (January 2006 - November 2026).7 The VIXEQ was at 42.77, above its long-run average of 31.73 (June 2014 - November 2026).8
Key Takeaway
Implied correlation more than doubled, yet stayed unusually low for such a large decline in the index, consistent with Cboe’s interpretation of a rotation away from AI rather than broad contagion. Relative volatility told the same story. Implied volatility on the tech-heavy Nasdaq-100 Index rose to nearly a record premium over the S&P 500 Index, while the premium on the small-cap Russell 2000 Index narrowed to among its smallest in several years.9 The theme I noted in August persists: elevated single-stock volatility is not fully translating into index volatility because correlation remains low. If stocks begin moving together more closely, index volatility could rise sharply even without a further increase in single-stock volatility.
Sources:
1,3-5,7,8Bloomberg
2,6,9Cboe – Week of 11/9/2026: No Contagion (Yet): Equity Vol Spikes, Macro Vol Fades; 11/9/26
This material is for informational use only. The views expressed are those of the author, and do not necessarily reflect the views of Penn Mutual Asset Management. This material is not intended to be relied upon as a forecast, research or investment advice, and it is not a recommendation, offer or solicitation to buy or sell any securities or to adopt any investment strategy.
Opinions and statements of financial market trends that are based on current market conditions constitute judgment of the author and are subject to change without notice. The information and opinions contained in this material are derived from sources deemed to be reliable but should not be assumed to be accurate or complete. Statements that reflect projections or expectations of future financial or economic performance of the markets may be considered forward-looking statements. Actual results may differ significantly. Any forecasts contained in this material are based on various estimates and assumptions, and there can be no assurance that such estimates or assumptions will prove accurate.
Investing involves risk, including possible loss of principal. Past performance is no guarantee of future results. All information referenced in preparation of this material has been obtained from sources believed to be reliable, but accuracy and completeness are not guaranteed. There is no representation or warranty as to the accuracy of the information and Penn Mutual Asset Management shall have no liability for decisions based upon such information.
High-Yield bonds are subject to greater fluctuations in value and risk of loss of income and principal. Investing in higher yielding, lower rated corporate bonds have a greater risk of price fluctuations and loss of principal and income than U.S. Treasury bonds and bills. Government securities offer a higher degree of safety and are guaranteed as to the timely payment of principal and interest if held to maturity.
All trademarks are the property of their respective owners. This material may not be reproduced in whole or in part in any form, or referred to in any other publication, without express written permission.