Strong Labor Force Fuels Strong Economic Growth
March 14, 2024
.png "Source: Bloomberg")
The latest U.S. real gross domestic product (GDP) increased 2.5% in 2023, 1 exceeding the expectations of many economists. Initial projections from the December 2022 Federal Open Market Committee (FOMC) meeting placed the figure at a modest 0.5%.2 The resilience of the U.S. economy amidst a challenging monetary tightening cycle is impressive, with several contributing factors becoming apparent.
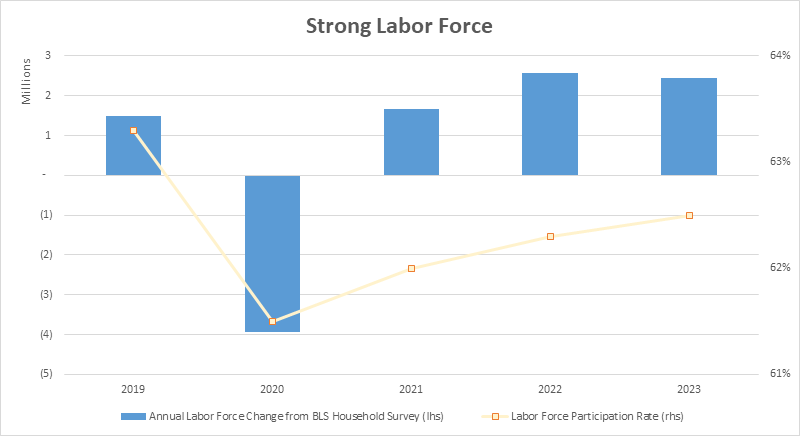
Remarkable labor force growth emerges as a significant driver of economic resilience. Data from the U.S. Bureau of Labor Statistics (BLS) shows that in 2023, the total labor force expanded by approximately 2.5 million, as demonstrated in today’s chart.3 This marks a notable increase compared to the average of approximately 1.7 million labor force growth annually from 2015 to 2019, driven by both population growth and a rising labor force participation rate.
Furthermore, the recent increase in the labor force and labor force participation rate have played a role in quelling inflation. The year-over-year increase in the consumer price index (CPI) has decreased from the June 2022 peak of 9.1% to 3.2% in February 2024.4 This disinflation process is noteworthy for not causing significant demand destruction, suggesting that rapid supply adjustments are driving the trend. As I analyzed in a previous Chart of the Week post, a robust labor force is crucial for sustainable growth without inflationary pressures.
Key Takeaway
Looking ahead, the sustainability of the recent strong labor force growth and its long-term impact on financial markets raises questions. The current increase appears to reflect a normalization following disruptions during the COVID-19 pandemic. From a financial markets perspective, strong labor force growth signals high economic output capacity, potentially leading to higher equilibrium interest rates, assuming all other factors remain constant. This partly explains the economy's ability to withstand high policy rates lately and introduces uncertainties into the path of monetary policy.
Sources:
1Bureau of Economic Analysis – Gross Domestic Product, Fourth Quarter and Year 2023 (Advance Estimate); 1/25/24
2Board of Governors of the Federal Reserve System – Summary of Economic Projections; 12/14/22
3Bloomberg
4U.S. Bureau of Labor Statistics – Consumer Price Index Summary; 07/13/23 and 3/12/24
This material is for informational use only. The views expressed are those of the author, and do not necessarily reflect the views of Penn Mutual Asset Management. This material is not intended to be relied upon as a forecast, research or investment advice, and it is not a recommendation, offer or solicitation to buy or sell any securities or to adopt any investment strategy.
Opinions and statements of financial market trends that are based on current market conditions constitute judgment of the author and are subject to change without notice. The information and opinions contained in this material are derived from sources deemed to be reliable but should not be assumed to be accurate or complete. Statements that reflect projections or expectations of future financial or economic performance of the markets may be considered forward-looking statements. Actual results may differ significantly. Any forecasts contained in this material are based on various estimates and assumptions, and there can be no assurance that such estimates or assumptions will prove accurate.
Investing involves risk, including possible loss of principal. Past performance is no guarantee of future results. All information referenced in preparation of this material has been obtained from sources believed to be reliable, but accuracy and completeness are not guaranteed. There is no representation or warranty as to the accuracy of the information and Penn Mutual Asset Management shall have no liability for decisions based upon such information.
High-Yield bonds are subject to greater fluctuations in value and risk of loss of income and principal. Investing in higher yielding, lower rated corporate bonds have a greater risk of price fluctuations and loss of principal and income than U.S. Treasury bonds and bills. Government securities offer a higher degree of safety and are guaranteed as to the timely payment of principal and interest if held to maturity.
All trademarks are the property of their respective owners. This material may not be reproduced in whole or in part in any form, or referred to in any other publication, without express written permission.