Diverging Interest Rate Sensitivities
April 18, 2024
.png "Source: Bloomberg")
So far in 2024, the S&P 500 Index has greatly outperformed the Russell 2000 Index, which is composed of small-cap companies. On a total return basis, through April 12, 2024, the S&P has returned 7.86% while the Russell 2000 has returned -0.8%.1 Breaking this down further, the Magnificent Seven has returned 15.33%, while the S&P 500 ex Magnificent Seven has returned 4.95% as of April 12, 2024.2 The Russell 2000 still has yet to match its high from January 2022, while the S&P has surged above that previous high. In today’s Chart of the Week, I will provide one explanation for this divergence in performance between the largest and smallest U.S. companies.
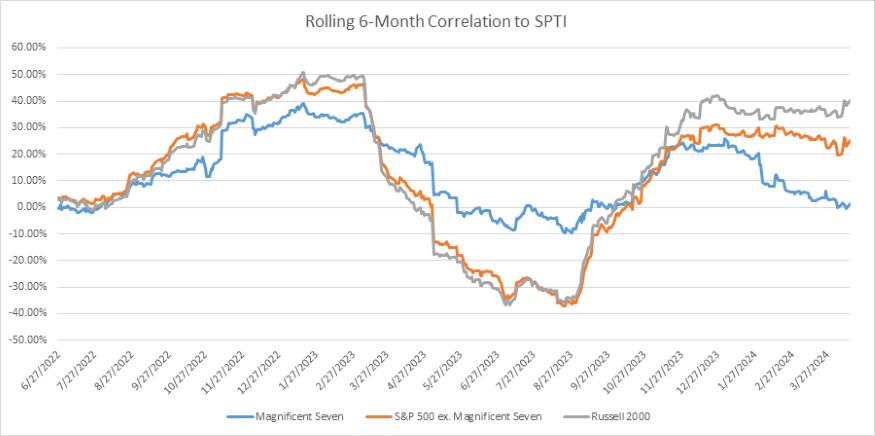
This week’s chart shows the rolling 6-month return correlation of the Magnificent Seven, S&P 500 ex Magnificent Seven and Russell 2000 with the SPDR Portfolio Intermediate Term Treasury ETF (SPTI), which holds U.S. government bonds with maturities between five and ten years. Here, a positive correlation means that equities tend to increase when rates increase or vice versa, and a negative correlation means that equities tend to decrease when rates increase or vice versa. The general rule of thumb in the investment community has been that equities and bonds should be negatively correlated, hence providing diversification benefits when held together. In a previous Chart of the Week post, I demonstrated that this scenario has not always been the case, as the correlation flipped positive in 2022 when the Federal Reserve (Fed) began raising rates. Today’s chart further highlights the correlation between different groups of companies. In 2022 and 2023, while at different levels, the trend of the equity/bond correlation tended to move in the same direction for all three groups. In 2024, this story has changed. The Magnificent Seven’s correlation to bonds has moved sharply downwards, while small-cap correlation to bonds has remained high and positive. The S&P 500 ex Magnificent Seven has seen its correlation to bonds remain high and positive as well, only enjoying a small portion of the downward movement experienced by the Magnificent Seven.
The aforementioned is occurring against a backdrop of rates moving sharply higher. So far this year, the 10-year Treasury has increased 64 basis points (bps) as of April 12, 2024.3 This sharp rise in yield has been caused by a combination of strong economic growth, a resilient labor market and hotter-than-expected inflation. This data has caused the market to go from pricing in six cuts by the Fed in 2024 to now only two cuts. So why is the Magnificent Seven able to take higher rates for longer in stride while small caps continue to show weakness? One answer lies in the differences in corporate structure between small caps and their very large and profitable counterparts.
In general, the companies that comprise the Magnificent Seven are already very profitable and still experiencing good earnings growth. In addition, they were able to take advantage of the era of low interest rates and tight credit spreads post-pandemic to lock in long-term debt very cheaply. They also tend to sit on large piles of cash, evidenced by the index net debt to earnings before interest, taxes, depreciation and amortization (EBITDA) coming in at -0.19.4 These companies are earning short-term rates on their cash that is higher than what they pay for their long-term debt. The longer short-term rates remain high, the longer this dynamic exists. And while the breadth of the index has improved this year, the Magnificent Seven still comprises 29.6% of the index as of April 17, 2024,5 making it very difficult for performance to diverge from the performance of these mega caps.
This strongly contrasts with the state of small-cap balance sheets. At an index level, the Russell 2000 has a net debt to EBITDA of 4.27.6 On top of the sheer amount of debt, many of these companies are not highly rated and either need to tap the high-yield bond or leveraged loan market where spreads are wider. In the case of leveraged loans, the debt often is floating rate. Any small-cap companies with floating-rate debt saw their cash position continually squeezed throughout the last two years. As the year has unfolded, the prospect of some relief has faded away. On the other hand, any high-yield debt set to expire that needs refinancing will have to be issued in a higher interest rate environment. The ability to wait for rates to decrease prior to refinancing is becoming less of a reality with every strong piece of growth, labor or inflation data.
Key Takeaway
The stock/bond correlation has shown a stark contrast this year when examining small caps and the Magnificent Seven separately. In general, the Magnificent Seven stocks have strong earnings growth and solid balance sheets. With large cash positions, these companies are being paid to be patient and tactical when it comes to deploying capital.
On the other hand, small caps are trading with high sensitivity to interest rates. The prospect of higher-for-longer rates, coupled with weaker balance sheets, puts them in a more precarious position compared to their mega-cap peers. However, there is more to the story than just rates. On the bright side, the resilience of the economy has resulted in credit spreads trading to multi-year lows, taking away one source of pain when tapping the debt markets. Continued strong economic growth should boost the earnings prospects of small caps as well. Earnings are reported in nominal terms, so while stickier inflation will most likely keep rates higher for longer, this may be partly offset by increased revenues from sustained high prices.
Sources:
1-6Bloomberg
This material is for informational use only. The views expressed are those of the author, and do not necessarily reflect the views of Penn Mutual Asset Management. This material is not intended to be relied upon as a forecast, research or investment advice, and it is not a recommendation, offer or solicitation to buy or sell any securities or to adopt any investment strategy.
Opinions and statements of financial market trends that are based on current market conditions constitute judgment of the author and are subject to change without notice. The information and opinions contained in this material are derived from sources deemed to be reliable but should not be assumed to be accurate or complete. Statements that reflect projections or expectations of future financial or economic performance of the markets may be considered forward-looking statements. Actual results may differ significantly. Any forecasts contained in this material are based on various estimates and assumptions, and there can be no assurance that such estimates or assumptions will prove accurate.
Investing involves risk, including possible loss of principal. Past performance is no guarantee of future results. All information referenced in preparation of this material has been obtained from sources believed to be reliable, but accuracy and completeness are not guaranteed. There is no representation or warranty as to the accuracy of the information and Penn Mutual Asset Management shall have no liability for decisions based upon such information.
High-Yield bonds are subject to greater fluctuations in value and risk of loss of income and principal. Investing in higher yielding, lower rated corporate bonds have a greater risk of price fluctuations and loss of principal and income than U.S. Treasury bonds and bills. Government securities offer a higher degree of safety and are guaranteed as to the timely payment of principal and interest if held to maturity.
All trademarks are the property of their respective owners. This material may not be reproduced in whole or in part in any form, or referred to in any other publication, without express written permission.