Penn Mutual AM 1847 Income Fund Celebrates 3-Year Anniversary
September 26, 2023

PMAM is pleased to announce that the Penn Mutual AM 1847 Income Fund (PMEFX) recently celebrated its 3-year anniversary, achieving this milestone track record among other accolades.
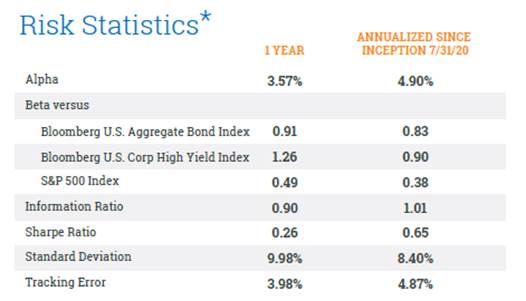
The Fund was launched in July 2020 and has navigated unprecedented market conditions since its inception, all while continuing to deliver consistent results. We believe the Fund information ratio of 1.01 since inception, as noted below, reflects continued strong performance relative to benchmark on a risk-adjusted basis.
1. What’s compelling about PMEFX? Why should investors consider investing in PMEFX?
In our view, garnering income while also attempting to attain a reasonable level of total return is an attractive combination that is not always easily achieved through a full market cycle. Both the stock and bond markets can experience bouts of volatility that could leave investors with losses (i.e. 2022). One of the key hallmarks of the Fund’s strategy is its focus on risk and avoidance of downside volatility without giving up the potential for upside gains. The return history over the past three years has certainly displayed these characteristics.
The Fund leans upon a few key tenets to achieve these goals. One key attribute is the Fund’s flexibility from an asset allocation standpoint. The Fund has the ability to adjust to market environments and valuations to help find, what we believe to be, the best combination of upside potential and downside protection. Another important part of the investment process is the Fund’s bottom-up security selection. This bottom-up versus top-down approach gives us the potential to add value through a full market cycle. Security selection is an important way that we take our risk-focused approach down to the individual holding level. Building a portfolio from the bottom-up tends to provide insights and observations that can be applied throughout the Fund.
2. What has contributed to the Fund’s outperformance since inception?
Individual security selection and asset allocation have both contributed to the Fund’s outperformance since inception. For example, on the stock side, PMEFX stocks outperformed its Russell 3000 Value Index by more than 1,875 basis points (bps) in 2022.1 Additionally, the Fund avoided risk by maintaining an ultra-low duration positioning when interest rates were abnormally low.
The Fund performed admirably in its first full calendar year — 2021 — finishing in the top 19th percentile of its Morningstar Moderately Conservative Allocation category with a total return of 9.78%, outperforming its category average by more than 150 bps.2
During its second full year in 2022, the Fund really proved what its investment process seeks — relative stability in a time of extreme volatility. As both stocks and bonds declined significantly, PMEFX held its own, finishing in the top two percentile of its Morningstar Moderately Conservative Allocation category and declining a fraction of its peers and indexes, finishing the year down only 4.29% and outperforming its Morningstar category average by more than 900 bps.3
The past few years have been great examples of sharp contrast in both stock and bond market performance. This was a great test for investment managers of all strategies. The team was able to execute its investment process well enough to allow their investors to experience the great majority of gains in up markets while avoiding the great majority of losses experienced in 2021. We are very proud of this result and plan to continue to do well for shareholders in the years to come.
3. How may the Fund’s active approach create value for investors in the current environment?
Portfolio management’s willingness to go where we see value, move against the crowd and avoid obvious risk are other key hallmarks that guide the Fund through most market environments. This strategy requires a common sense approach to ensuring that for each investment made in the portfolio that we are getting, in our opinion, a reasonable potential return without accepting more risk than necessary. Simply put, if we do not believe we will receive an adequate amount of compensation/total return for the risk we are assuming, we will wait. And if our data shows that we are receiving a good balance of potential reward versus risk, we will act. This philosophy has helped to avoid making big mistakes by staying away from overheated/overvalued markets and investing aggressively when the odds and value are in our favor.
In the current environment with sharply higher interest rates, our focus is on companies that possess strong balance sheets with solid cash positions. In our view, these cash-rich companies are actually benefiting from higher rates as they are earning higher levels of interest income. Conversely, we seek to avoid companies that are overleveraged and suffering under the weight of higher interest expense. A bottom-up view of the markets enables us to see these types of opportunities to potentially add value and decrease risk.
1Source: Bloomberg as of 12/31/2022.
2Source: Morningstar Direct as of 12/31/2021.
3Source: Morningstar Direct as of 12/31/2022.
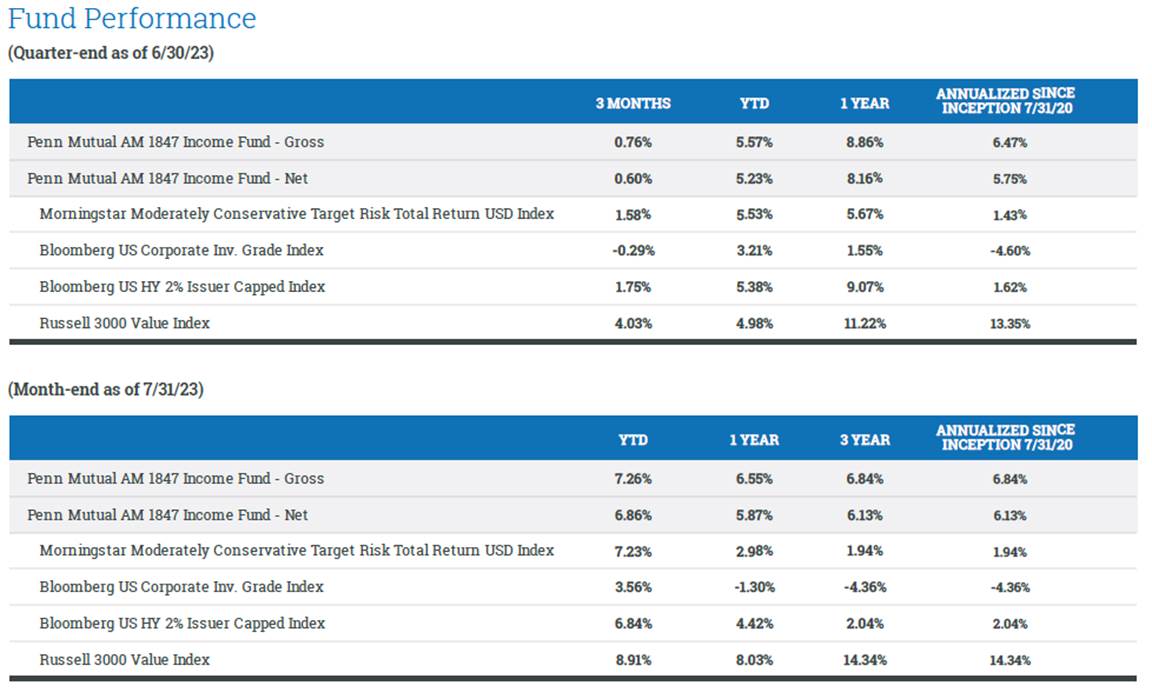
Total Fund Operating Expense: 0.65% Net* 1.11% Gross; *Fee waivers are contractual and in effect until May 31, 2024.
Performance data shown represents past performance and is not a guarantee of future results. Investment performance and principal value will fluctuate, so when redeemed, may be worth more or less than their original cost. Current performance may be lower or higher than the performance data quoted. For the most recent month-end performance, please call 877-PMA-MLLC (877-762-6552).
*Unless otherwise indicated, all data is reported as of July 31, 2023 and is not a representation of current or future data. Holdings and allocations are subject to change.
Risk statistics are shown as supplemental information only. Risk statistics are derived using gross returns.
Visit our website here to learn more about the PMEFX.
For more information about the Fund, contact Chris Fanelli, managing director, business development, at fanelli.chris@pennmutualam.com or (609) 306-7034.
To download this announcement, please see the attachment below.
About PMAM
With approximately $32 billion in assets under management as of July 31, 2023, Penn Mutual Asset Management ("PMAM") is an institutional asset management firm located just outside of Philadelphia, PA that has been offering investment solutions and client-focused services since 1989.
Follow the latest news and insights from the PMAM investment team at The Long View, as well as on LinkedIn and X (formerly known as Twitter).
__________________________________________________________________________________
Important Information
The information contained herein has been prepared solely for informational purposes. It is subject to change without notice and it is not intended as an offer or solicitation of the Funds nor any other products or services offered by PMAM. Please note this information has been prepared as a general summary without consideration of any specific investors, thus please do not use this material solely to make any investment decisions. All investors should always refer to the prospectus to learn more about the Fund before investing.
Investors should consider the investment objectives, risks, charges and expenses carefully before investing. For the full prospectus, which contains this and other information about the Fund, please visit www.pennmutualam.com/strategies/balanced-income-strategy. Investors should read the prospectus carefully before investing.
The Fund is distributed by SEI Investments Distribution Co. (SIDCO) at 1 Freedom Valley Drive, Oaks, PA 19456, which is not affiliated with Penn Mutual Asset Management.
Important Information: Investing involves risk, including possible loss of principal. The Fund’s other investment risks include, but are not limited to, interest rate, inflation, credit and default risk associated with fixed income securities. In addition, high yield bonds have a higher risk of default or other adverse credit events. Other risks include, but are not limited to, equity risk, preferred stock risk, allocation risk, conflicts of interest risk, counterparty credit risk, foreign investments risk, high portfolio turnover risk, liquidity risk and volatility risk. There is no guarantee the Fund will achieve its stated objective. Indices are unmanaged and do not include the effect of fees. One cannot invest directly in an index.
Definitions
Alpha – A measure of the performance of an investment against a market index or benchmark which is considered to represent the market’s movement as a whole.
Beta – A measure of the volatility, or systematic risk, or a security or a portfolio in comparison to the market as a whole. A beta of 1 indicates that the security’s price moves with the market. A beta of less than 1 means that the security is theoretically less volatile than the market and a beta greater than 1 indicates that the security’s price is theoretically more volatile than the market.
Duration – A measure of the sensitivity of the price -- the value of principal -- of a fixed-income investment to a change in interest rates. Duration is expressed as a number of years.
Information Ratio – A risk-adjusted performance measure. The information ratio is a special version of the Sharpe Ratio in that the benchmark doesn't have to be the risk-free rate.
Sharpe Ratio – A measure for calculating risk-adjusted return. The Sharpe ratio is the average return earned in excess of the risk-free rate per unit of volatility or total risk.
Standard Deviation – A measure of the dispersion of a set of data from its mean. If the data points are further from the mean, there is higher deviation within the data set.
Tracking Error – A measure of volatility of excess returns relative to a benchmark.
Bloomberg U.S. Aggregate Bond Index – An index that is a broad-based flagship benchmark that measures the investment grade, US dollar denominated, fixed-rate taxable bond market. The index includes Treasuries, government-related and corporate securities, MBS (agency fixed-rate and hybrid ARM pass-throughs), ABS and CMBS (agency and non-agency).
Bloomberg U.S. Corp High Yield – An index measures the USD-denominated, high-yield, fixed-rate corporate bond market. Securities are classified as high yield if the middle rating of Moody’s Fitch and S&P is Ba1/BB+/BB+ or below. Bonds from issuers with an emerging markets country of risk, based on the indices’ EM country definition, are excluded.
Bloomberg U.S. Corporate Investment Grade Index – An index that measures the investment grade, fixed-rate, taxable corporate bond market. It includes USD denominated securities publicly issued by US and non-US industrial, utility and financial issuers.
Bloomberg U.S. High Yield 2% Issuer Cap Index – An issuer-constrained version of the flagship US Corporate High Yield Index, which measures the USD-denominated, high yield, fixed-rate corporate bond market. The index follows the same rules as the uncapped version, but limits the exposure of each issuer to 2% of the total market value and redistributes any excess market value indexwide on a pro rata basis.
Morningstar Moderately Conservative Target Risk Total Return USD Index – The Morningstar Target Risk Index family is designed to meet the needs of investors who would like to maintain a target level of equity exposure through a portfolio diversified across equities, bonds and inflation-hedged instruments. The Morningstar Moderately Conservative Target Risk Index seeks approximately 40% exposure to global equity markets.
Russell 3000 Value Index – An index that measures the performance of the broad value segment of the US equity value universe. It includes those Russell 3000® companies with lower price-to-book ratios and lower forecasted growth values.
S&P 500 Index – An index of 500 stocks chosen for market size, liquidity and industry grouping, among other factors. The S&P 500 is designed to be a leading indicator of U.S. equities and is meant to reflect the risk/return characteristics of the large cap universe.