2023 Economic and Market Review
January 5, 2024
.jpg "iStock-878043044_Financial graph with world map (2).jpg")
As we enter 2024, the PMAM investment team reflects on 2023, summarizing notable economic and financial market themes that occurred throughout the year.
ECONOMIC GROWTH & INFLATION
U.S. economic growth surprised to the upside during 2023 despite significant headwinds as the year progressed, most prominent being severe stress in the banking system in March and April. The dire economic forecasts so widespread at the outset of the year proved to be overly pessimistic as U.S. consumers, refusing to buy into the recession narrative, were eager to spend with a renewed emphasis on “experiences” as opposed to “things.”
The pandemic-driven supply pressures continued to ease in most segments of the U.S. economy, with one key exception being the labor market. Job openings in the U.S. — approximately 8.79 million as of November — remain well above pre-pandemic levels.1 The labor market remains tight despite a steady increase in labor force participation over the last two years. Similar to other stories across the economy and markets, growing divergences are appearing in the labor markets. Office jobs are becoming harder to find, while employers in sectors such as manufacturing, healthcare, restaurants and hospitality are struggling to fill positions.
The Federal Reserve’s (Fed) forecasts for the full-year 2023 economic growth increased steadily as the year progressed — now standing at 2.6%.2 The third quarter gross domestic product (GDP) reading of 4.9% was stronger than even the most bullish economic forecasts. Even with the number of recession forecasts dwindling, economic growth is expected to slow next year, with numerous headwinds finally starting to bite. The lagged effects of monetary tightening, including tighter bank lending standards, pandemic savings running down and the resumption of student loan repayments, are all expected to weigh on economic growth in 2024.
Better than expectations also applies to the inflationary environment this year. The deceleration in inflation came despite the absence of “pain to households and businesses” Fed Chair Jerome Powell thought necessary at this point last year.3 The recent decline in oil prices helped to bring headline inflation measures down materially since the start of the year. Year-over-year personal consumption expenditures (PCE) inflation declined to 2.6% in November, the lowest level since the Fed started hiking interest rates in March 2022.4 The Fed now expects inflation will trend “lower in coming years as demand and supply in product and labor markets move into better alignment.”5
MONETARY & FISCAL POLICY
The Fed raised interest rates during four of its first five meetings of the year, bringing the upper end of the range for the federal funds rate to 5.50%.6 Fed policymakers continue to provide ample communication and forward guidance, leaving little doubt about most of this year’s rate decisions. The only Fed meeting decision in doubt was in March, taking place shortly after the sudden failure of Silicon Valley Bank. The Fed did not waver from its inflation-fighting resolve, following through with a quarter-point rate hike.
The promise for “higher for longer” interest rates ended abruptly when Chair Jerome Powell delivered unexpectedly “dovish” messaging during his November Federal Open Market Committee (FOMC) meeting press conference. The December Fed meeting left no doubt about the monetary policy pivot. The December “dot plot” (Fed projections for short-term interest rate levels) showed three rate cuts projected in 2024.
Fiscal spending in the U.S. remains above pre-pandemic levels, driven by rising interest costs in addition to higher defense and industrial spending. This year’s election and a highly divided government will likely keep any talk of fiscal discipline in Washington, D.C., on the back burner. The first real test of Congress will be to reduce the fiscal imbalances with the expiration of the Tax Cuts & Jobs Act in January 2026.
The U.S. Treasury’s decision on November 1 to increase the issuance of shorter-dated notes coincided with more “dovish” messaging from the Fed. The timing begs the question of whether the Fed’s “dovish” turn was partially driven by fiscal policy considerations. Interest costs to service the U.S. government debt are approaching the $1 trillion mark, with rising interest rates the primary culprit.7 As we enter a presidential election year with a deepening political divide, the Fed’s independence and adherence to its dual mandate goals are certain to be a focus for investors regardless of the ultimate path for monetary policy.
INTEREST RATES & CREDIT
Heightened interest rate volatility was a common theme throughout 2023, starting with the sudden onset of a banking crisis in March. The failures of Silicon Valley Bank and Signature Bank — the second and third largest U.S. bank failures on record — sparked a flight to quality and a sharp decline in Treasury rates. The Treasury 2-year note yields fell 130 basis points (bps) in 16 days — from 5.07% to 3.77% — then reversed course nearly as quickly, moving back to the 5% level by early July.8
The extreme interest rate volatility shifted to the long end of the yield curve during the second half of the year. The downgrade of the U.S. government by Fitch Ratings in early August, weak demand during the August Treasury long bond auction and continued “higher for longer” messaging from the Fed all factored in to a rapid rise in long-term Treasury yields. The 10-year Treasury yield touched the 5% level in early October — up 170 bps in just six months.9
The bond market was on the precipice of a third consecutive year of negative returns — a losing streak that has never occurred before — until the Fed came to the rescue in November. The bond market not only bought into the idea of impending rate cuts after the December Fed meeting but almost immediately raced to get ahead of the Fed with six rate cuts now priced in by the end of 2024.10 Despite the dramatic interest moves throughout the year, the 10-year Treasury closed the year exactly where it started — 3.88%.11
Treasury Inflation-Protected Securities (TIPS) valuations also rebounded strongly following the Fed’s November shift in narrative. In line with the path of nominal bond yields, real yields moved steadily higher for the majority of the year, with the 10-year real yield reaching 2.5% by late October — the highest level since 2008.12 Despite ongoing fears that inflation would prove to be “sticky” at levels well above the Fed’s 2% target, 10-year breakeven inflation, or the market implied inflation rate, hovered in a narrow range between 2.1% and 2.5% for the majority of 2023.13
Credit markets also proved remarkably resilient this year excluding a brief window of stress in the midst of the March banking crisis. Investor concerns about an economic hard landing gradually declined as the year progressed. Investment-grade (IG) corporate credit outperformed duration-matched Treasuries by 455 bps in 2023, while the high-yield market registered a total return of 13.45%. The final two months of 2023 witnessed the “lion’s share” of the credit markets’ excess and absolute annual returns.
The Fed’s quantitative tightening program, sharply reduced bank demand and historically high rate volatility weighed on agency mortgage-backed securities (MBS) valuations for the first 10 months of the year. However, similar to other risk assets, MBS valuations rose materially and spreads tightened after the Fed signaled the end of the current rate hiking cycle in early November. Hampered by record-low home affordability, the housing market needed help on the interest rate front. Secondary home supply is being constrained by fewer homeowners in a position to sell their homes with mortgage rates more than doubling over the past two years.
Exhibit 1. 2023 Bond Market Performance
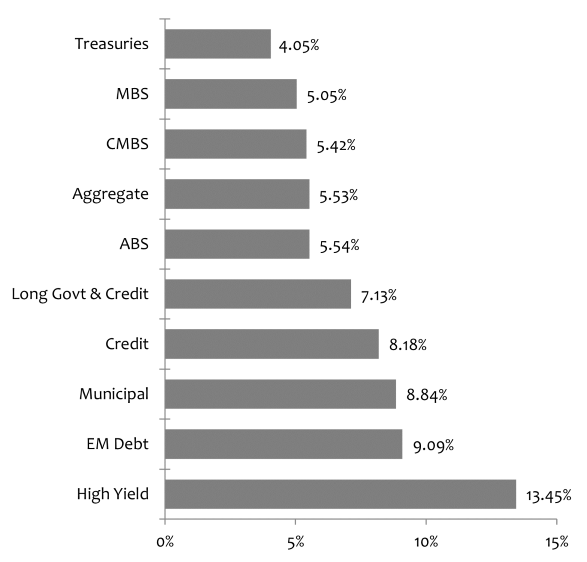
Source: Bloomberg
Equity Markets
The equity markets in 2023 likely provided the clearest example that widening divergences make broad-based conclusions very difficult. For example, the S&P 500 Index performance was up more than 26% for the year, but under the surface, the great majority of stocks did not fare nearly as well. Excluding the now famous Magnificent 7 mega-cap growth stocks, the S&P 500 Index posted total returns of approximately 11%, while small-cap stocks, as measured by the Russell 2000 Index, were up approximately 17%. Even further, many dividend stocks, led down by utilities and mid-to-small sized banks, underperformed materially in value this year. A divergent collection of stocks that trade at vastly different price and valuation levels driven by a handful of large companies that are growing nicely are leaving the rest of the market in the rearview mirror.
From a valuation perspective, stripping out the very largest companies, the stock market is not particularly expensive, and in some segments, stocks are cheap — when viewed through the lens of future earnings growth. The market is clearly willing to reward companies that have shown earnings per share (EPS) growth and is punishing ones that are in decline. With growth just as concentrated as the market, viewing the market on a more granular level could provide some key opportunities to add value from individual stocks. Valuations for many stocks are good, and prudent due diligence can uncover improving situations.
Exhibit 2. 2023 Financial Market Performance
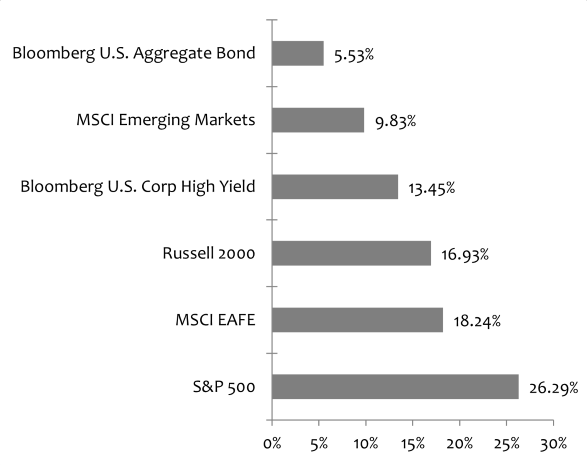
Source: Bloomberg
Now that 2023 has come to an end, what can investors expect in 2024? Be sure to check back next week for our 2024 Capital Markets Outlook!
Sources:
1U.S. Bureau of Labor Statistics – Job Openings and Labor Turnover Survey; 1/3/24
2,8,9,11,12Bloomberg
3Board of Governors of the Federal Reserve System – Monetary Policy and Price Stability Speech by Fed Chair Jerome Powell; 8/26/22
4U.S. Bureau of Economic Analysis – Personal Income and Outlays, November 2023; 12/22/23
5Board of Governors of the Federal Reserve System – Minutes of the Federal Open Market Committee; October 31–November 1, 2023 Meeting
6U.S. Bank Wealth Management – Federal Reserve focuses monetary policy on fighting inflation; 12/15/23
7Independent Institute – Total Interest on National Debt Approaching $1 Trillion; 11/10/23
10CNBC – Fed officials in December saw rate cuts likely, but path highly uncertain, minutes show; 1/3/24
13Federal Reserve Bank of St. Louis – 10-Year Breakeven Inflation Rate; as of January 2024
Index Definitions:
Bloomberg U.S. Aggregate ABS Total Return Index – An index that is the ABS component of the U.S. Aggregate Index and has three subsectors: credit and charge cards, autos and utility. The index includes pass-through, bullet and controlled amortization structures and includes only the senior class of each ABS issue and the ERISA-eligible B and C tranche.
Bloomberg U.S. Aggregate Bond Index – An index that is a broad-based flagship benchmark that measures the investment grade, U.S. dollar-denominated, fixed-rate taxable bond market. The index includes Treasuries, government-related and corporate securities, MBS (agency fixed-rate pass-throughs), ABS and CMBS (agency and non-agency).
Bloomberg U.S. CMBS Index – An Index that measures the investment-grade market of U.S. Agency and U.S .Non-Agency conduit and fusion CMBS deals with a minimum current deal size of $300mm that are ERISA eligible.
Bloomberg U.S. Corporate High Yield Bond Index – An index that measures the USD-denominated, high yield, fixed-rate corporate bond market.
Bloomberg U.S. Credit Index – An index that measures the investment grade, U.S. dollar-denominated, fixed-rate, taxable corporate and government-related bond markets.
Bloomberg Emerging Markets USD Aggregate Index – A flagship hard currency Emerging Markets debt benchmark that includes fixed and floating-rate U.S. dollar-denominated debt issued from sovereign, quasi-sovereign and corporate EM issuers.
Bloomberg U.S. Long Government/Credit Index – An index that is a broad-based flagship benchmark that measures the non-securitized component of the U.S. Aggregate Index with 10 or more years to maturity. The index includes investment grade, U.S. dollar-denominated, fixed-rate treasuries, government-related and corporate securities.
Bloomberg U.S. Mortgage Backed Securities (MBS) Index – An index that tracks agency mortgage backed pass-through securities (both fixed-rate and hybrid ARM) guaranteed by Ginnie Mae (GNMA), Fannie Mae (FNMA) and Freddie Mac (FHLMC).
Bloomberg U.S. Municipal Index – An index that covers the USD-denominated long-term tax exempt bond market. The index has four main sectors: state and local general obligations bonds, revenue bonds, insured bonds and prerefunded bonds.
Bloomberg U.S. Treasury Index – An index that measures U.S. dollar-denominated, fixed-rate, nominal debt issued by the U.S. Treasury.
MSCI EAFE Index – An index that is designed to measure the equity market performance of developed markets outside of the U.S. & Canada.
MSCI Emerging Markets Index – A free float-adjusted market capitalization index that is designed to measure equity market performance in the global emerging markets.
Russell 2000 Index – An index measuring the performance of approximately 2,000 small cap companies in the Russell 3000 Index, which is comprised of 3,000 of the largest U.S. stocks.
S&P 500 Index – An index of 500 stocks chosen for market size, liquidity and industry grouping, among other factors. The S&P 500 is designed to be a leading indicator of U.S. equities and is meant to reflect the risk/return characteristics of the large cap universe.
All trademarks are the property of their respective owners.
Disclosures:
The views expressed in this material are the views of PMAM through the year ending December 31, 2023, and are subject to change based on market and other conditions. This material contains certain views that may be deemed forward-looking statements. The inclusion of projections or forecasts should not be regarded as an indication that PMAM considers the forecasts to be reliable predictors of future events. Any forecasts contained in this material are based on various estimates and assumptions, and there can be no assurance that such estimates or assumptions will prove accurate. Actual results may differ significantly.
Past performance is not indicative of future results. The views expressed do not constitute investment advice and should not be construed as a recommendation to purchase or sell securities. All information has been obtained from sources believed to be reliable, but accuracy is not guaranteed. There is no representation or warranty as to the accuracy of the information and PMAM shall have no liability for decisions based upon such information.
This material is for informational use only. The views expressed are those of the author, and do not necessarily reflect the views of Penn Mutual Asset Management. This material is not intended to be relied upon as a forecast, research or investment advice, and it is not a recommendation, offer or solicitation to buy or sell any securities or to adopt any investment strategy.
Opinions and statements of financial market trends that are based on current market conditions constitute judgment of the author and are subject to change without notice. The information and opinions contained in this material are derived from sources deemed to be reliable but should not be assumed to be accurate or complete. Statements that reflect projections or expectations of future financial or economic performance of the markets may be considered forward-looking statements. Actual results may differ significantly. Any forecasts contained in this material are based on various estimates and assumptions, and there can be no assurance that such estimates or assumptions will prove accurate.
Investing involves risk, including possible loss of principal. Past performance is no guarantee of future results. All information referenced in preparation of this material has been obtained from sources believed to be reliable, but accuracy and completeness are not guaranteed. There is no representation or warranty as to the accuracy of the information and Penn Mutual Asset Management shall have no liability for decisions based upon such information.
High-Yield bonds are subject to greater fluctuations in value and risk of loss of income and principal. Investing in higher yielding, lower rated corporate bonds have a greater risk of price fluctuations and loss of principal and income than U.S. Treasury bonds and bills. Government securities offer a higher degree of safety and are guaranteed as to the timely payment of principal and interest if held to maturity.
All trademarks are the property of their respective owners. This material may not be reproduced in whole or in part in any form, or referred to in any other publication, without express written permission.